





What is cloud cost growth rate?
What does a cost growth rate chart look like in Metabase?
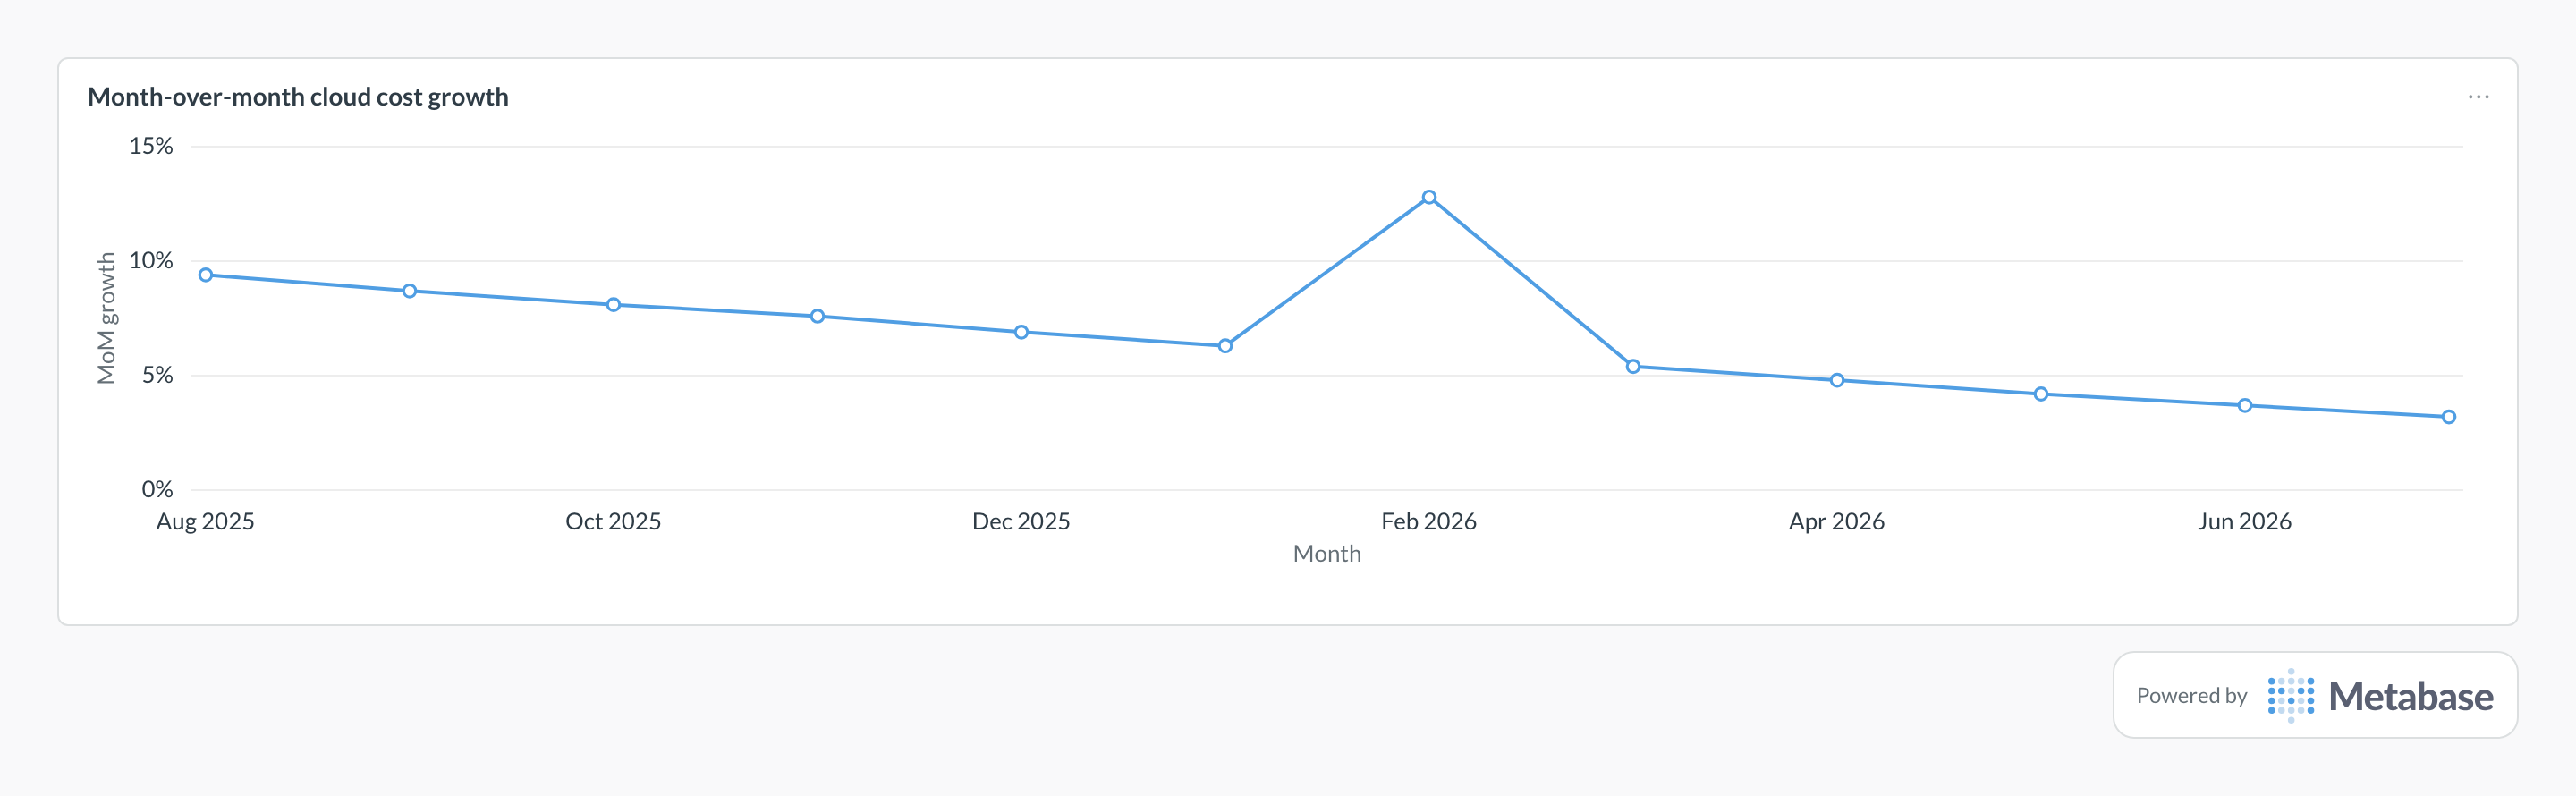
Chart month-over-month growth on complete months only, and watch the level settle rather than chasing every wiggle. The drift toward low single digits means spend is scaling slower than the business, while a spike like February’s usually traces to one launch — a new GPU workload, say — worth attributing by dollar delta before treating it as a trend.
Definition
Cost growth rate measures how fast cloud spend is changing — month over month for operational response, year over year for planning. The number only becomes useful when attributed: growth from new workloads, existing-workload usage, or pricing changes are different problems with different owners.
What data do you need?
- Complete-month cost rollups under one convention
- Service, account, and team dimensions for attribution
- First-seen dates for services and workloads to separate new from existing
- Usage quantities alongside cost to separate usage from rate changes
- Customer or revenue growth for the comparison view
SQL pattern
WITH monthly AS (
  SELECT
    date_trunc('month', usage_date) AS month,
    service,
    SUM(amortized_cost_usd) AS cost
  FROM cost_daily_rollups
  WHERE usage_date < date_trunc('month', CURRENT_DATE)
  GROUP BY 1, 2
)
SELECT
  month,
  service,
  ROUND(cost, 2) AS cost,
  ROUND(cost - LAG(cost) OVER w, 2) AS delta_usd,
  ROUND(
    100.0 * (cost - LAG(cost) OVER w) / NULLIF(LAG(cost) OVER w, 0), 1
  ) AS growth_pct
FROM monthly
WINDOW w AS (PARTITION BY service ORDER BY month)
ORDER BY month DESC, ABS(cost - LAG(cost) OVER w) DESC NULLS LAST;
Common pitfalls
Where does this metric apply?
This metric commonly uses data from AWS Billing, Google Cloud Billing, Vantage, CloudZero, Kubecost, plus any warehouse models built on raw billing exports at the same grain.