





What is budget burn rate for cloud spend?
What does a budget burn rate chart look like in Metabase?
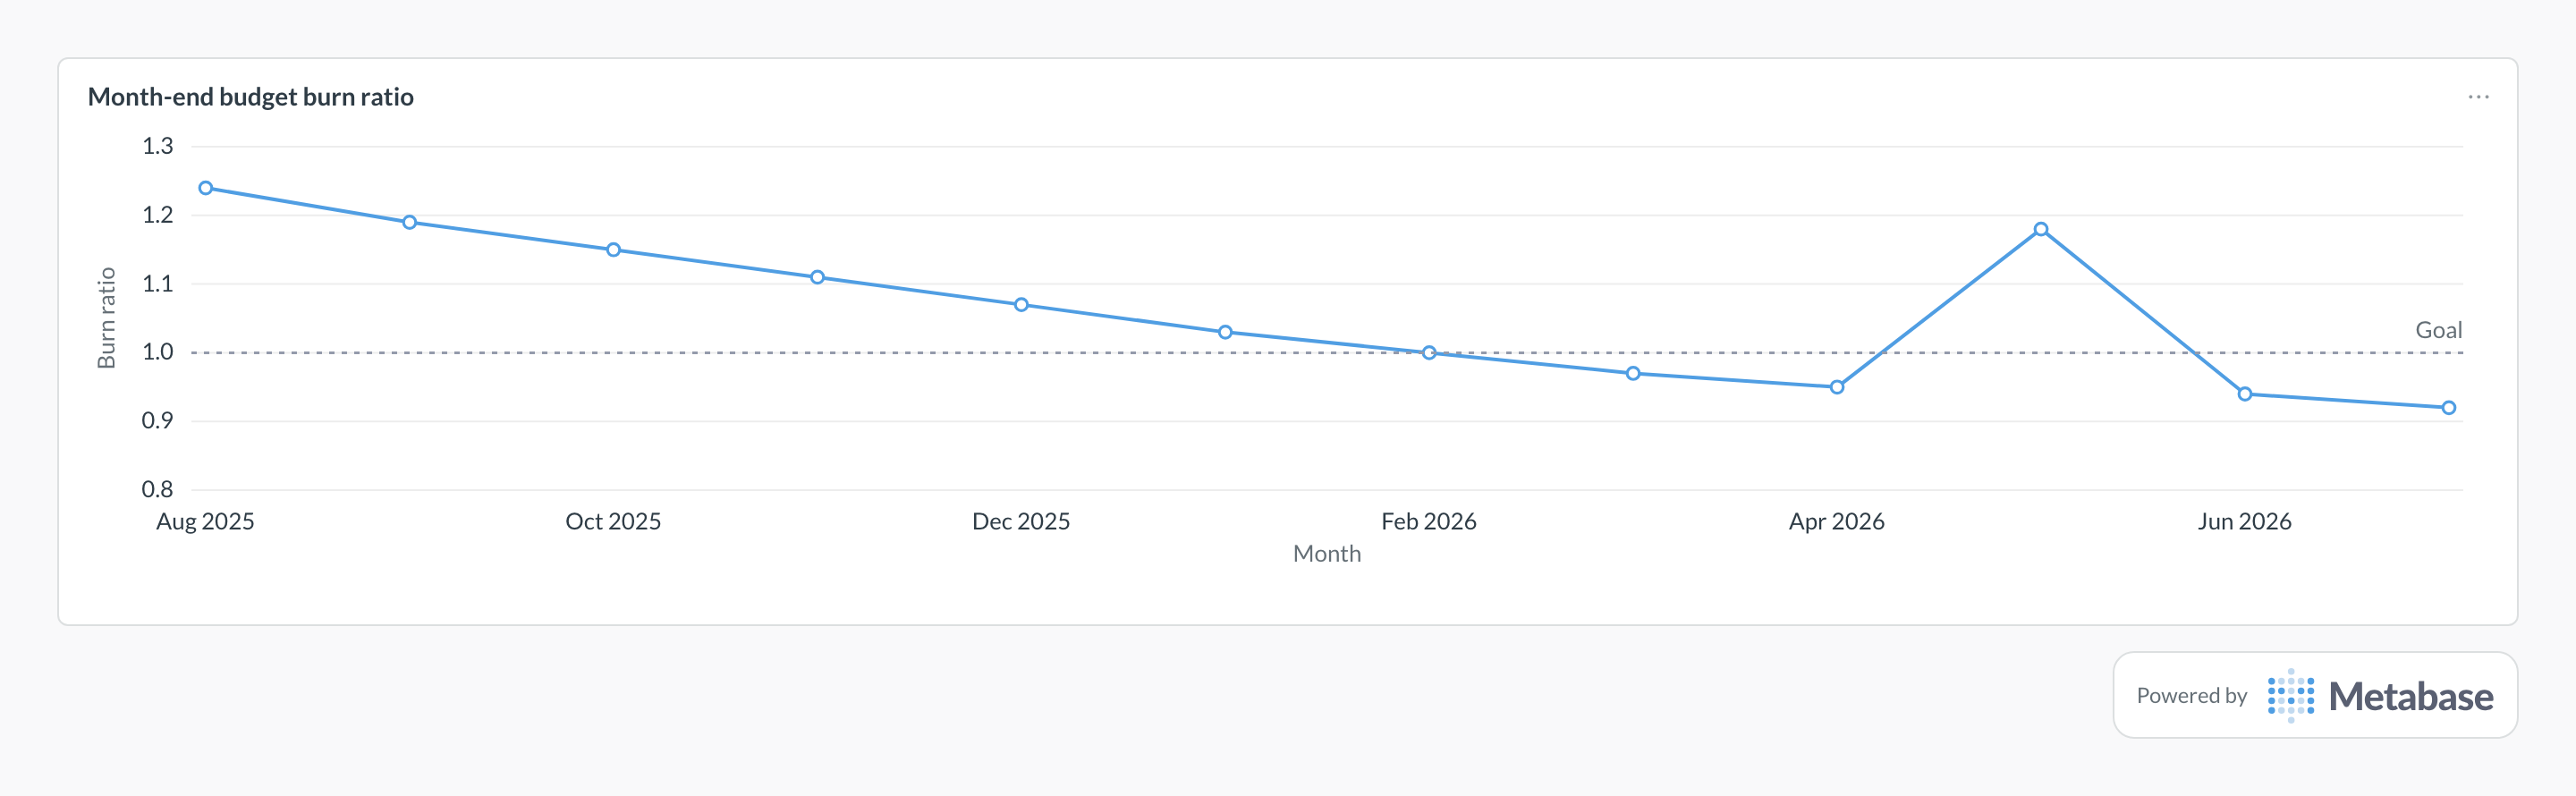
Compare the line against the goal at 1.0: above it, spend is consuming budget faster than the calendar; below it, the month lands under plan. The drift under the line shows budgets and forecasts converging, while a spike like May’s usually has a discrete cause — a one-time data-transfer charge — worth annotating on the card.
Definition
Budget burn rate compares how much of a cloud budget has been consumed against how much of the period has elapsed. Burn tracking above elapsed time is the earliest cheap warning that a month will overrun — long before the invoice arrives.
Formula: Burn ratio = (spend to date / budget) / (days elapsed / days in period); above 1.0 means overspending pace
What data do you need?
- Budget amounts per scope (team, account, project) per period
- Daily cost rollups matched to the same scopes
- The period calendar (fiscal months differ from calendar months)
- Known one-time charges to annotate spikes
- Forecast data where available for the exhaustion view
SQL pattern
Burn ratio by team for the current month PostgreSQL
WITH period AS (
  SELECT
    date_trunc('month', CURRENT_DATE)::date AS period_start,
    EXTRACT(day FROM CURRENT_DATE)::numeric AS days_elapsed,
    EXTRACT(day FROM (date_trunc('month', CURRENT_DATE)
      + INTERVAL '1 month - 1 day'))::numeric AS days_in_period
), spend AS (
  SELECT
    team,
    SUM(amortized_cost_usd) AS spend_to_date
  FROM cost_daily_rollups
  WHERE usage_date >= date_trunc('month', CURRENT_DATE)
  GROUP BY team
)
SELECT
  b.team,
  b.budget_usd,
  ROUND(s.spend_to_date, 2) AS spend_to_date,
  ROUND(100.0 * s.spend_to_date / NULLIF(b.budget_usd, 0), 1)
    AS budget_consumed_pct,
  ROUND(
    (s.spend_to_date / NULLIF(b.budget_usd, 0))
    / NULLIF(p.days_elapsed / p.days_in_period, 0), 2
  ) AS burn_ratio
FROM budgets b
JOIN spend s USING (team)
CROSS JOIN period p
WHERE b.month = p.period_start
ORDER BY burn_ratio DESC;
Common pitfalls
Comparing linear burn against a non-linear spend pattern. → Batch jobs and month-end charges skew daily spend; compare against the same team's historical intra-month curve where it matters.
Ignoring billing lag in the spend-to-date number. → Exports lag hours to days — show data freshness on the card, or burn always looks slightly healthy.
Setting budgets nobody revisits. → A burn ratio against a stale budget is theater; re-baseline budgets when workloads change materially.
Where does this metric apply?
This metric commonly uses data from AWS Billing, Google Cloud Billing, Vantage, CloudZero, plus any warehouse models built on raw billing exports at the same grain.
Related
Dashboards
Integrations
Metrics
Analytics
FAQ
At what burn ratio should alerts fire?
A common ladder: notify at 1.1× pace, page the owner at 1.25×, and escalate at forecast exhaustion before month end. Tune per team — steady workloads deserve tighter thresholds than bursty ones.
Is this the same as the finance burn rate metric?
No — burn rate in finance measures company cash consumption. Budget burn rate measures pace against a spending plan for a specific scope like cloud infrastructure.