





What is untagged spend rate?
What does an untagged spend rate chart look like in Metabase?
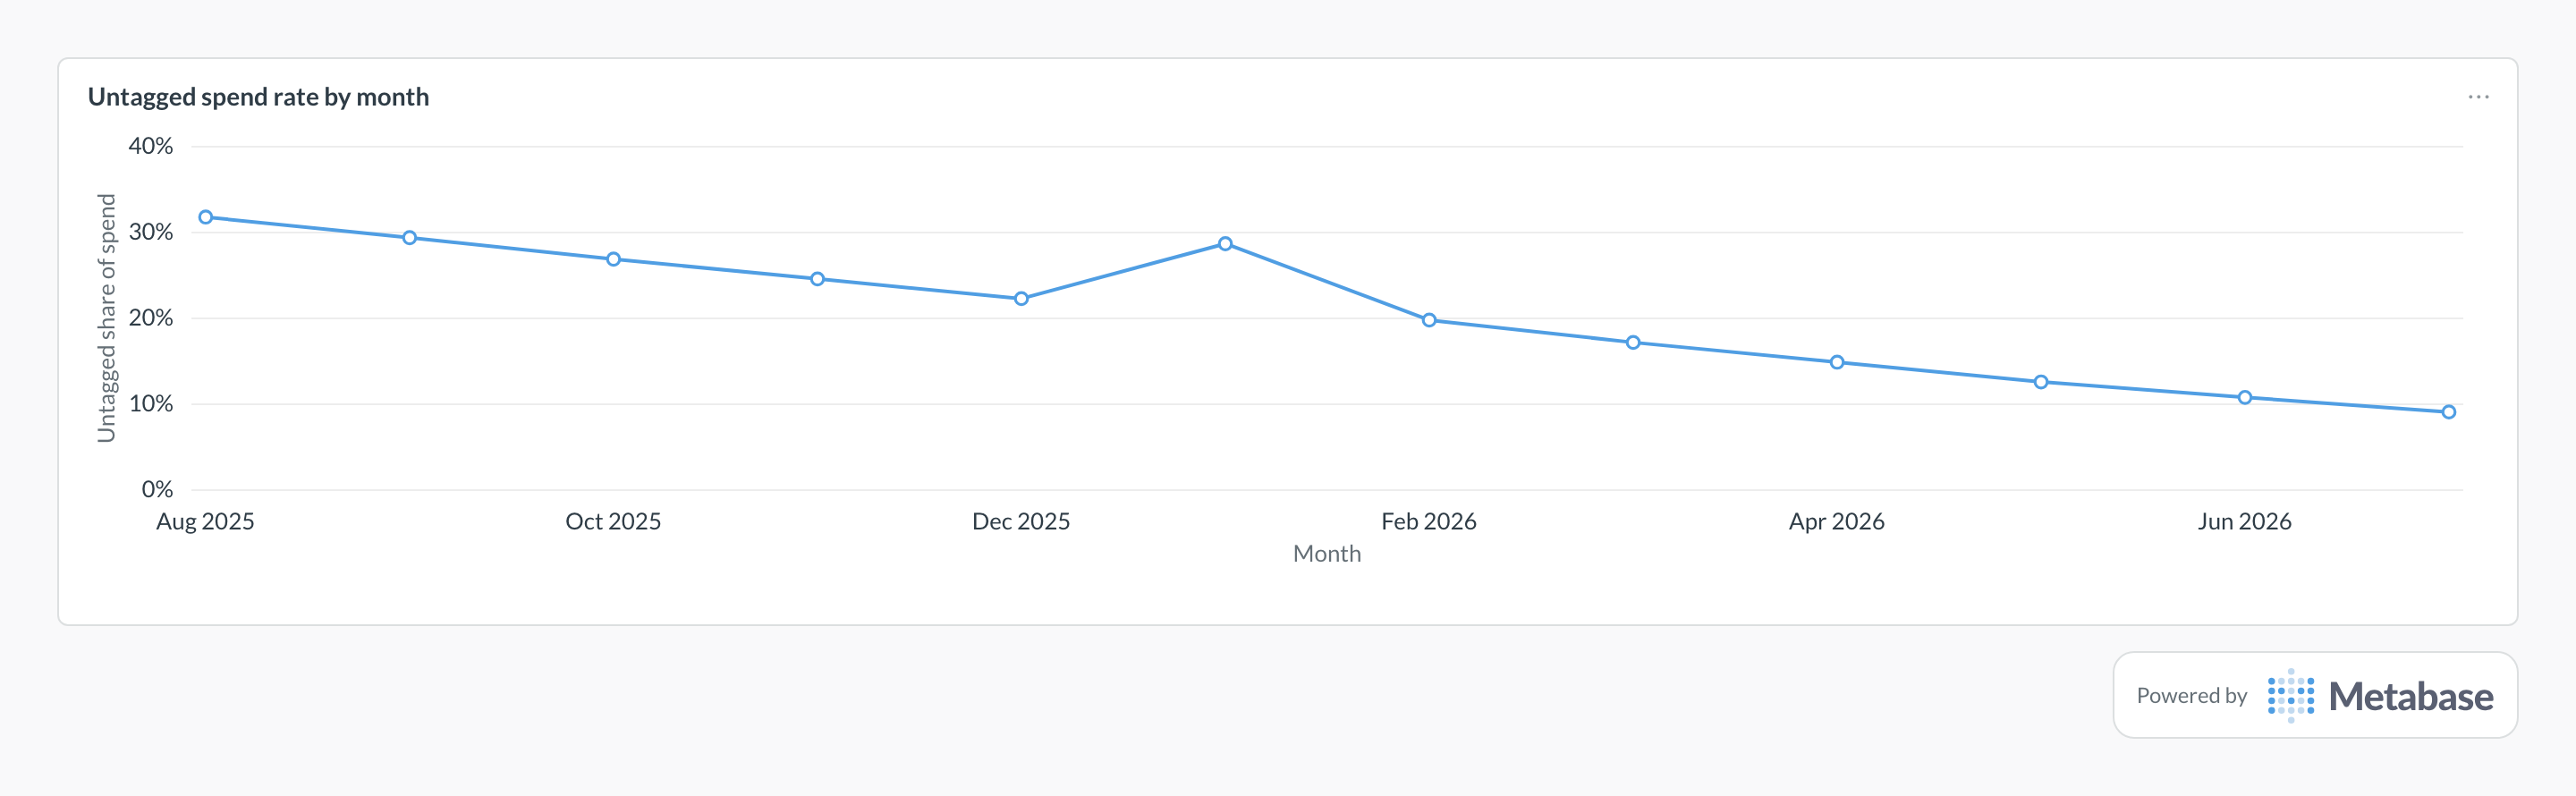
Read the line as the ceiling on every allocation view: the lower it goes, the more of the bill team dashboards can truthfully attribute. The steady decline shows tag enforcement working, while a bump like January’s usually means new infrastructure — an unlabeled cluster, a fresh account — landed ahead of its tags.
Definition
Untagged spend rate is the share of cloud cost carrying no owner tag — no team, project, or cost-center attribution. It is the ceiling on every allocation dashboard: if 30% of spend is untagged, team cost views are at best 70% true. Mature FinOps practices treat it as a first-class KPI with an owner.
What data do you need?
- Billing line items with tags and labels preserved through the pipeline
- The list of required tag keys (team, environment, service)
- A tag-to-owner mapping that normalizes variants and typos
- Resource identifiers so top untagged resources can be assigned
- Untaggable-spend classification (some charges can’t carry tags)
SQL pattern
SELECT
  date_trunc('month', usage_date) AS month,
  ROUND(
    100.0 * SUM(amortized_cost_usd) FILTER (WHERE team_tag IS NULL)
    / NULLIF(SUM(amortized_cost_usd), 0), 1
  ) AS untagged_spend_pct,
  ROUND(SUM(amortized_cost_usd) FILTER (WHERE team_tag IS NULL), 2)
    AS untagged_usd
FROM billing_line_items
WHERE line_item_type NOT IN ('Credit', 'Refund', 'Tax')
GROUP BY 1
ORDER BY 1;
Common pitfalls
Where does this metric apply?
This metric commonly uses data from AWS Billing, Google Cloud Billing, Kubecost, Vantage, plus any warehouse models built on raw billing exports at the same grain.