





What is cost per service?
What does a cost per service chart look like in Metabase?
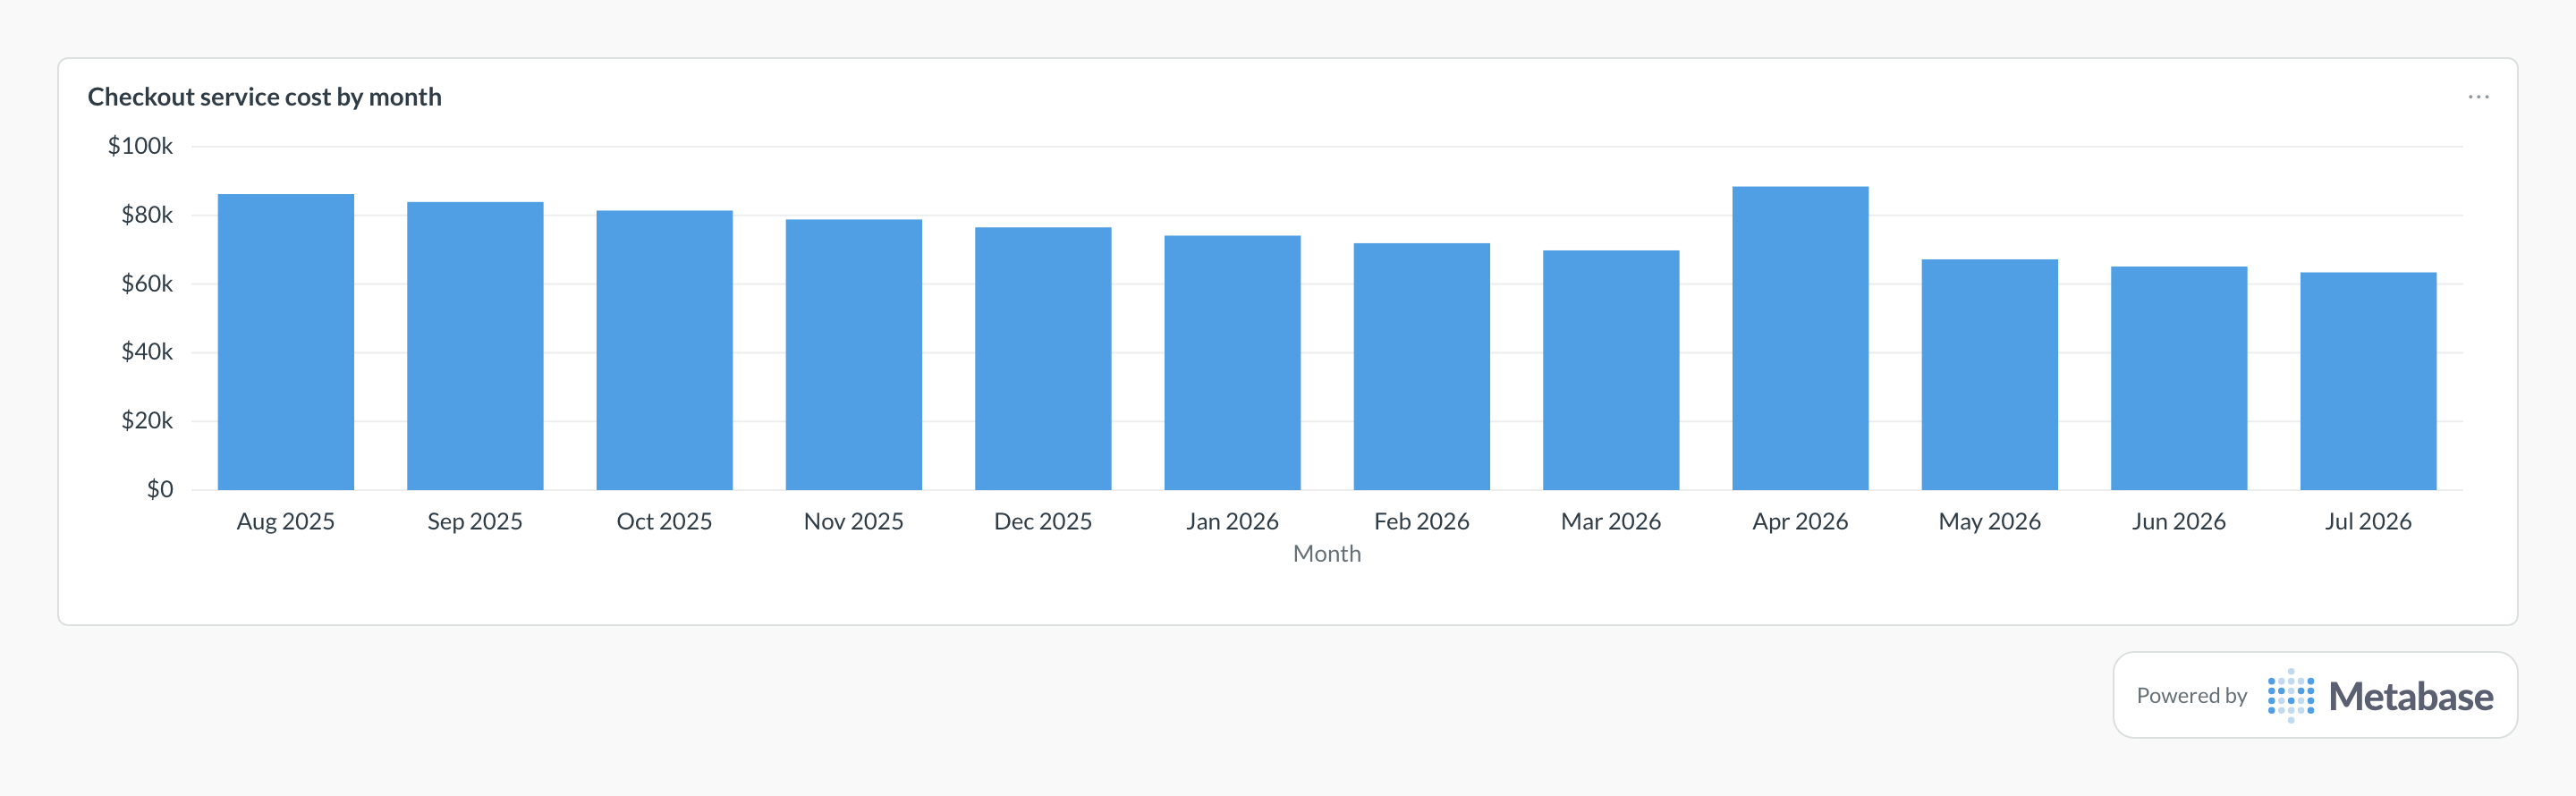
Chart one application service at a time so the platform total can’t hide who is growing. Checkout’s costs step down as rightsizing lands, while a jump like April’s — a load-test cluster left running past its window — is exactly the kind of blip a per-service view catches and assigns to an owner.
Definition
Cost per service breaks spend down by service — with a deliberate ambiguity to resolve first. Provider services (EC2, BigQuery) come free in every billing export; application services (checkout, search) are what engineering actually owns, and require mapping resources to services via tags, namespaces, or a service catalog.
What data do you need?
- Billing rollups with provider service dimensions
- A resource-to-application-service mapping (tags, namespaces, service catalog)
- Kubernetes allocation rollups where services share clusters
- Shared-infrastructure distribution rules for platform services
- Usage drivers per service for unit-cost views
SQL pattern
SELECT
  date_trunc('month', usage_date) AS month,
  COALESCE(app_service, 'unmapped') AS app_service,
  ROUND(SUM(amortized_cost_usd), 2) AS cost,
  ROUND(
    100.0 * SUM(amortized_cost_usd)
    / NULLIF(SUM(SUM(amortized_cost_usd)) OVER (
        PARTITION BY date_trunc('month', usage_date)
      ), 0), 1
  ) AS share_pct
FROM cost_daily_rollups
GROUP BY 1, 2
ORDER BY 1, cost DESC;
Common pitfalls
Where does this metric apply?
This metric commonly uses data from AWS Billing, Google Cloud Billing, Kubecost, Vantage, CloudZero, plus any warehouse models built on raw billing exports at the same grain.