





What goes in a cost-per-customer dashboard?
A cost-per-customer dashboard turns infrastructure spend into unit economics: what each customer or feature costs to serve, and — joined to revenue — what each actually earns. It requires an allocation path from billing data to customers, and an explicit rule for shared costs.
For: Finance, product leadership, FinOps, and founders. Refresh: daily for cost; monthly grain for margin reviews. Source: modeled billing and cost tables in a Metabase-connected database.
What does this dashboard look like?
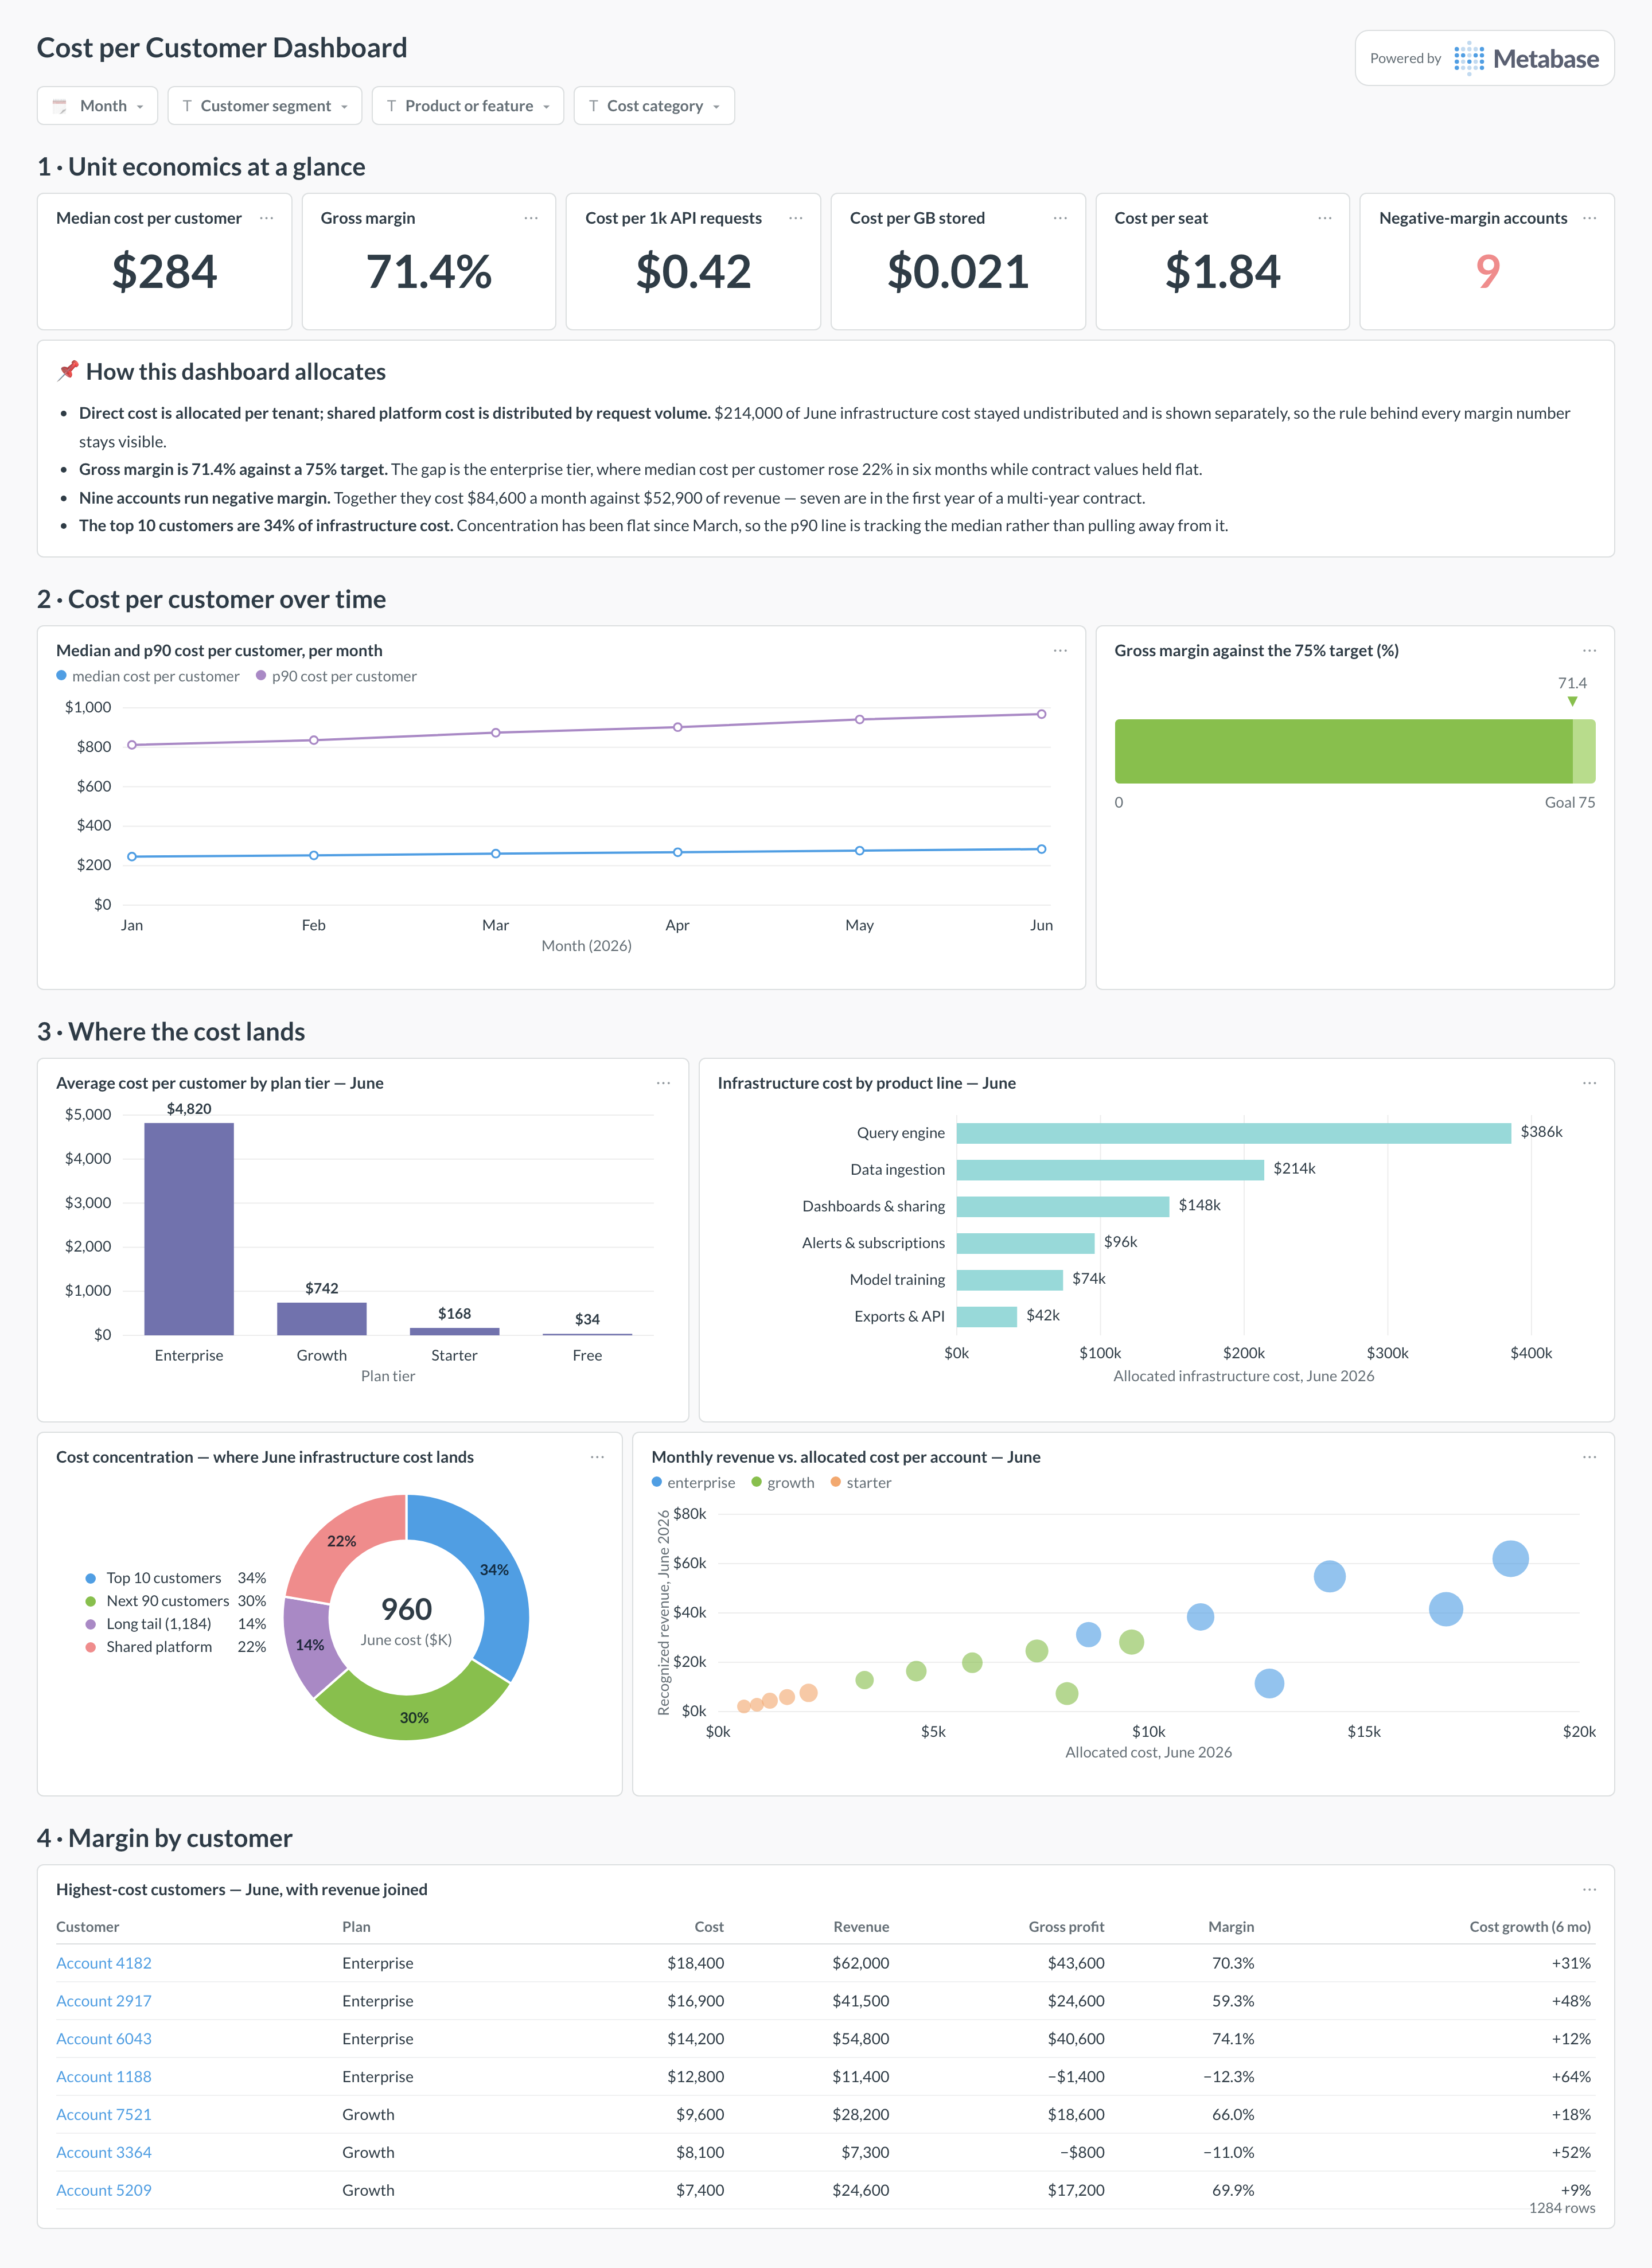
The layout starts with unit costs and margin, then breaks cost down by plan tier and product line, and ends with per-account revenue against cost — read it in the monthly margin review.
Which cards belong on this dashboard?
- Cost per customer, top 20 by cost
- Median and p90 cost per customer trend
- Margin by customer where revenue is joined
- Cost per feature or product line
- Customers whose cost is growing faster than revenue
- Shared and platform cost before distribution
- Unit cost per usage driver (per request, per GB, per seat)
- Cost concentration: share of spend from the top 10 customers
What data does this dashboard need?
- Cost allocated to customers via tags, tenancy mapping, or a cost platform
- Revenue per customer per month from billing or the CRM
- A documented shared-cost distribution rule
- Usage drivers (requests, storage, seats) for per-unit views
- A stable customer key shared by the cost and revenue sides
How do you build it?
- Land billing exports or cost-platform data in a database and keep raw line items, tags, timestamps, and pricing models.
- Build rollup models at the grain this dashboard needs, with cost conventions (amortized, unblended, net) as explicit columns.
- Create one saved question per card and certify the shared models and definitions.
- Add dashboard filters for Month, customer segment, product or feature, cost category.
- Show data freshness — billing exports lag, and every viewer should see by how much.
Example card SQL
Margin per customer from joined cost and revenue PostgreSQL
SELECT
  u.month,
  u.customer_id,
  ROUND(u.cost_usd, 2) AS cost,
  ROUND(u.revenue_usd, 2) AS revenue,
  ROUND(u.revenue_usd - u.cost_usd, 2) AS gross_profit,
  ROUND(
    100.0 * (u.revenue_usd - u.cost_usd) / NULLIF(u.revenue_usd, 0), 1
  ) AS margin_pct
FROM unit_costs u
WHERE u.month = date_trunc('month', CURRENT_DATE) - INTERVAL '1 month'
ORDER BY cost DESC
LIMIT 20;
Related
Dashboards
Integrations
Metrics
Analytics
FAQ
How do I allocate shared infrastructure to customers?
Choose a driver-based rule where you can (requests, storage, compute-hours per tenant) and an explicit fallback (proportional to direct cost) where you can't. Document the rule on the dashboard — it changes every margin number.
Is negative margin on a customer always bad?
Not necessarily — early-stage customers, free tiers, and strategic accounts can run negative deliberately. The dashboard's job is making it visible and trending it, so negative margin is a decision rather than a surprise.