




What goes in an IT security dashboard in Metabase?
An IT security dashboard tracks the hygiene of the IT estate — patch latency, endpoint protection coverage, MFA adoption, phishing-test results, and privileged accounts — rather than live threats. It answers "are we hard to attack?", while a SOC dashboard answers "are we being attacked?". Metabase builds it from your MDM, EDR, and identity-provider data synced to a warehouse.
For: IT managers, security engineers, and sysadmins. Grain: one row per device (or account) per day. Refresh: daily sync from MDM, EDR, and IdP — this is hygiene, not detection.
What does an IT security dashboard look like?
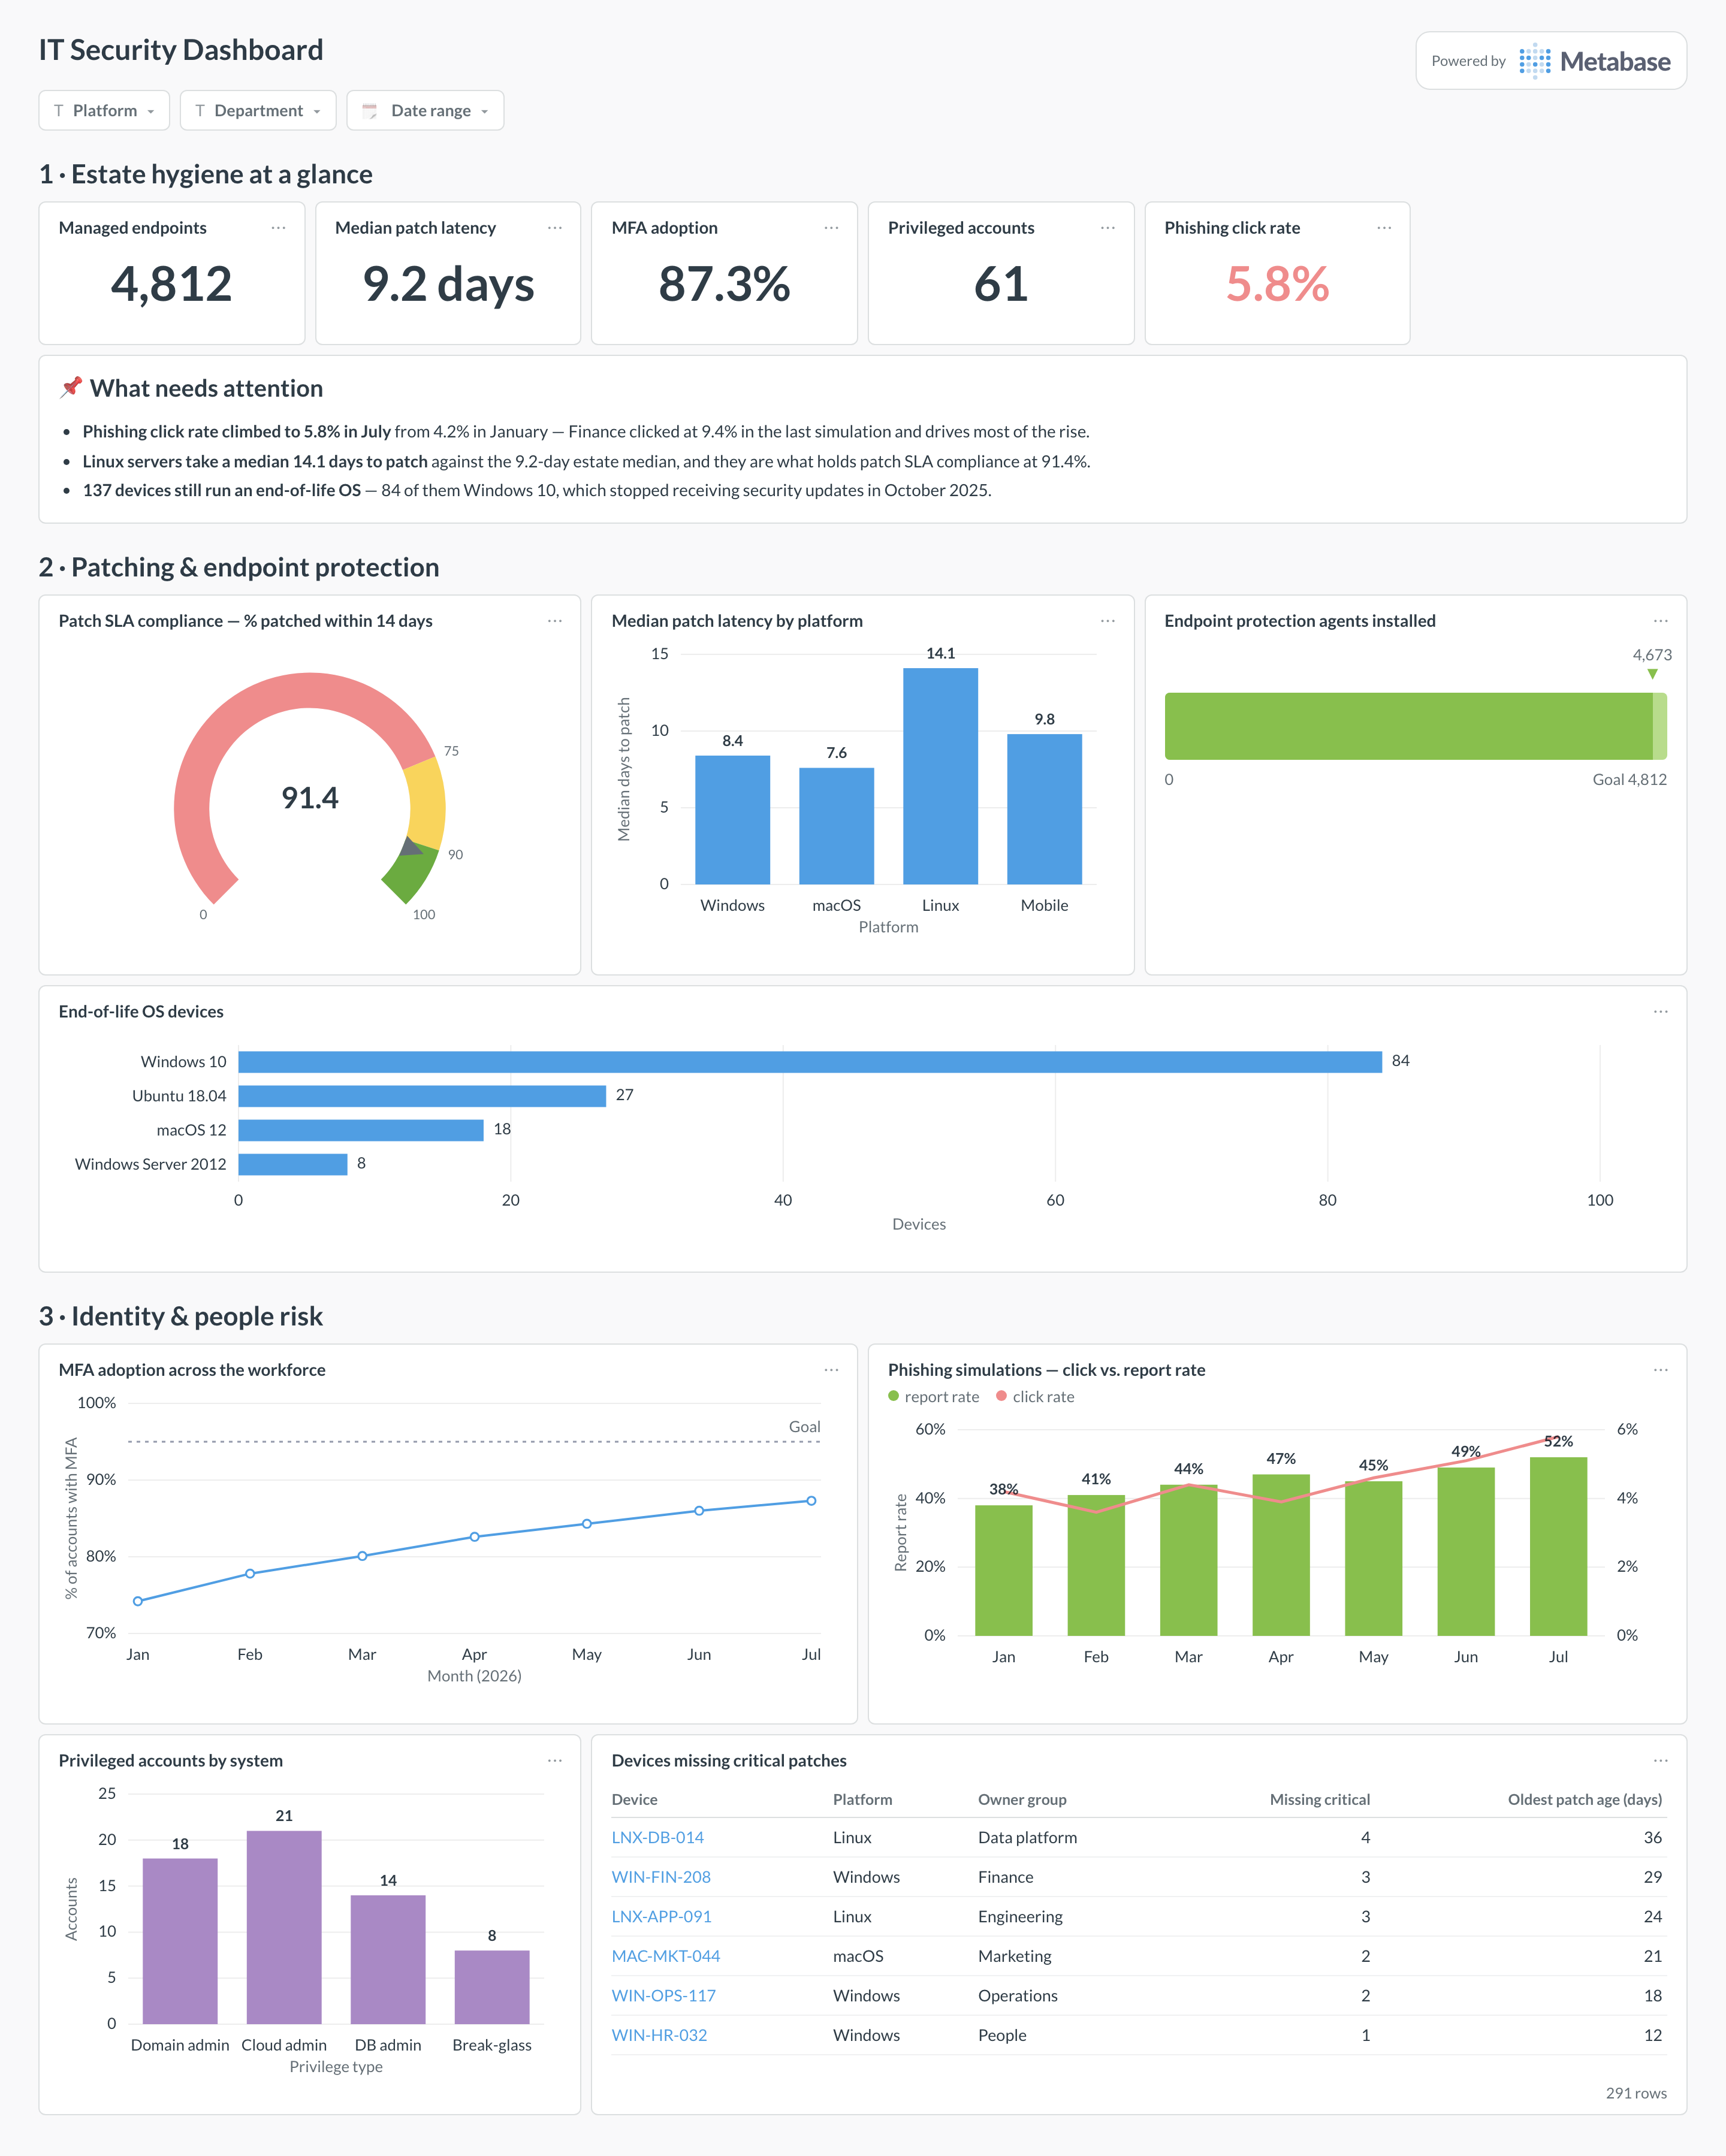
Here’s the layout this guide builds. Estate-wide hygiene numbers sit at the top so the weekly review starts from one row; patching and endpoint protection come next because unpatched, unprotected machines are the likeliest way in; identity and people risk — MFA, phishing results, privileged accounts — close the page because they change slowest and need the most follow-through.
Which cards belong on an IT security dashboard?
The eight below cover the three ways an estate quietly gets soft: machines that aren’t patched, machines that aren’t protected, and people who aren’t behind MFA or are being successfully phished.
- Patch SLA compliance — % of critical patches installed within 14 days (gauge)
- Median patch latency by platform — days from release to install (bar)
- Endpoint protection coverage — EDR agents installed vs. device inventory (progress)
- End-of-life OS devices — machines on operating systems no longer receiving updates (row)
- MFA adoption — % of accounts with MFA enrolled, against the target (line)
- Phishing simulations — click rate vs. report rate per campaign (combo)
- Privileged accounts by system — domain, cloud, database, and break-glass admins (bar)
- Devices missing critical patches — the worklist, with owner group and patch age (table)
What data does the dashboard need?
- A
devicestable from your MDM —device_id,platform,os_version,owner_group,retired_at— as the estate’s denominator. patchesandpatch_installs— patch, severity,released_at, and per-deviceinstalled_at— for latency and SLA math.- An EDR agent inventory (
agent_installswithdevice_id,last_seen_at) to compute protection coverage against the same denominator. - IdP exports:
userswithmfa_enrolledand factor type, plus admin-group memberships for the privileged-account count. - Phishing-simulation results per campaign —
delivered,clicked,reported, and the recipient’s department.
How do you build it?
- Sync MDM, EDR, and IdP data into your warehouse daily, each with a load timestamp — most of these tools export to a warehouse directly or via their API.
- Reconcile the device inventories first: match MDM devices to EDR agents on serial number or hostname, and decide which system is the denominator. Coverage percentages are meaningless until the denominators agree.
- Build one model per domain — patch status, endpoint coverage, identity — so every card computes “compliant” the same way, then save one question per card on top.
- Compute patch latency per patch-device pair (release date to install date), and materialize the median and the 14-day SLA percentage by platform.
- Add filters for platform, department, and date range, then subscribe the IT channel to a weekly snapshot — the table of devices missing critical patches is the worklist.
Example card SQL
WITH latest_patch AS (
SELECT
  d.device_id,
  d.platform,
  p.patch_id,
  p.released_at,
  pi.installed_at,
  EXTRACT(day FROM pi.installed_at - p.released_at) AS days_to_patch
FROM devices d
JOIN patches p
  ON p.platform = d.platform
 AND p.severity = 'critical'
 AND p.released_at >= now() - interval '90 days'
LEFT JOIN patch_installs pi
  ON pi.device_id = d.device_id
 AND pi.patch_id = p.patch_id
WHERE d.retired_at IS NULL
)
SELECT
platform,
COUNT(DISTINCT device_id)                              AS endpoints,
PERCENTILE_CONT(0.5)
  WITHIN GROUP (ORDER BY days_to_patch)                AS median_patch_latency_days,
ROUND(
  100.0 * COUNT(*) FILTER (WHERE days_to_patch <= 14)
    / NULLIF(COUNT(*), 0), 1
)                                                      AS pct_within_14_day_sla,
COUNT(*) FILTER (WHERE installed_at IS NULL)           AS installs_still_missing
FROM latest_patch
GROUP BY platform
ORDER BY median_patch_latency_days DESC;