



What goes in an Amazon S3 storage and cost dashboard in Metabase?
An Amazon S3 storage and cost dashboard tracks how much each bucket holds and in which storage class, how many requests it serves and how many of them fail, whether lifecycle rules are actually moving objects, and what all of that costs per bucket. It reads three sources — CloudWatch, S3 Storage Lens, and the Cost and Usage Report — and Metabase charts them side by side out of the warehouse you already land them in.
For: platform, data, and FinOps teams who own the buckets and the bill. Grain: one row per bucket per day, plus CUR line items.
Source:
CloudWatch BucketSizeBytes and request metrics, an S3 Storage Lens daily export, and a Cost and Usage Report with resource IDs enabled.
What does an S3 storage and cost dashboard look like?
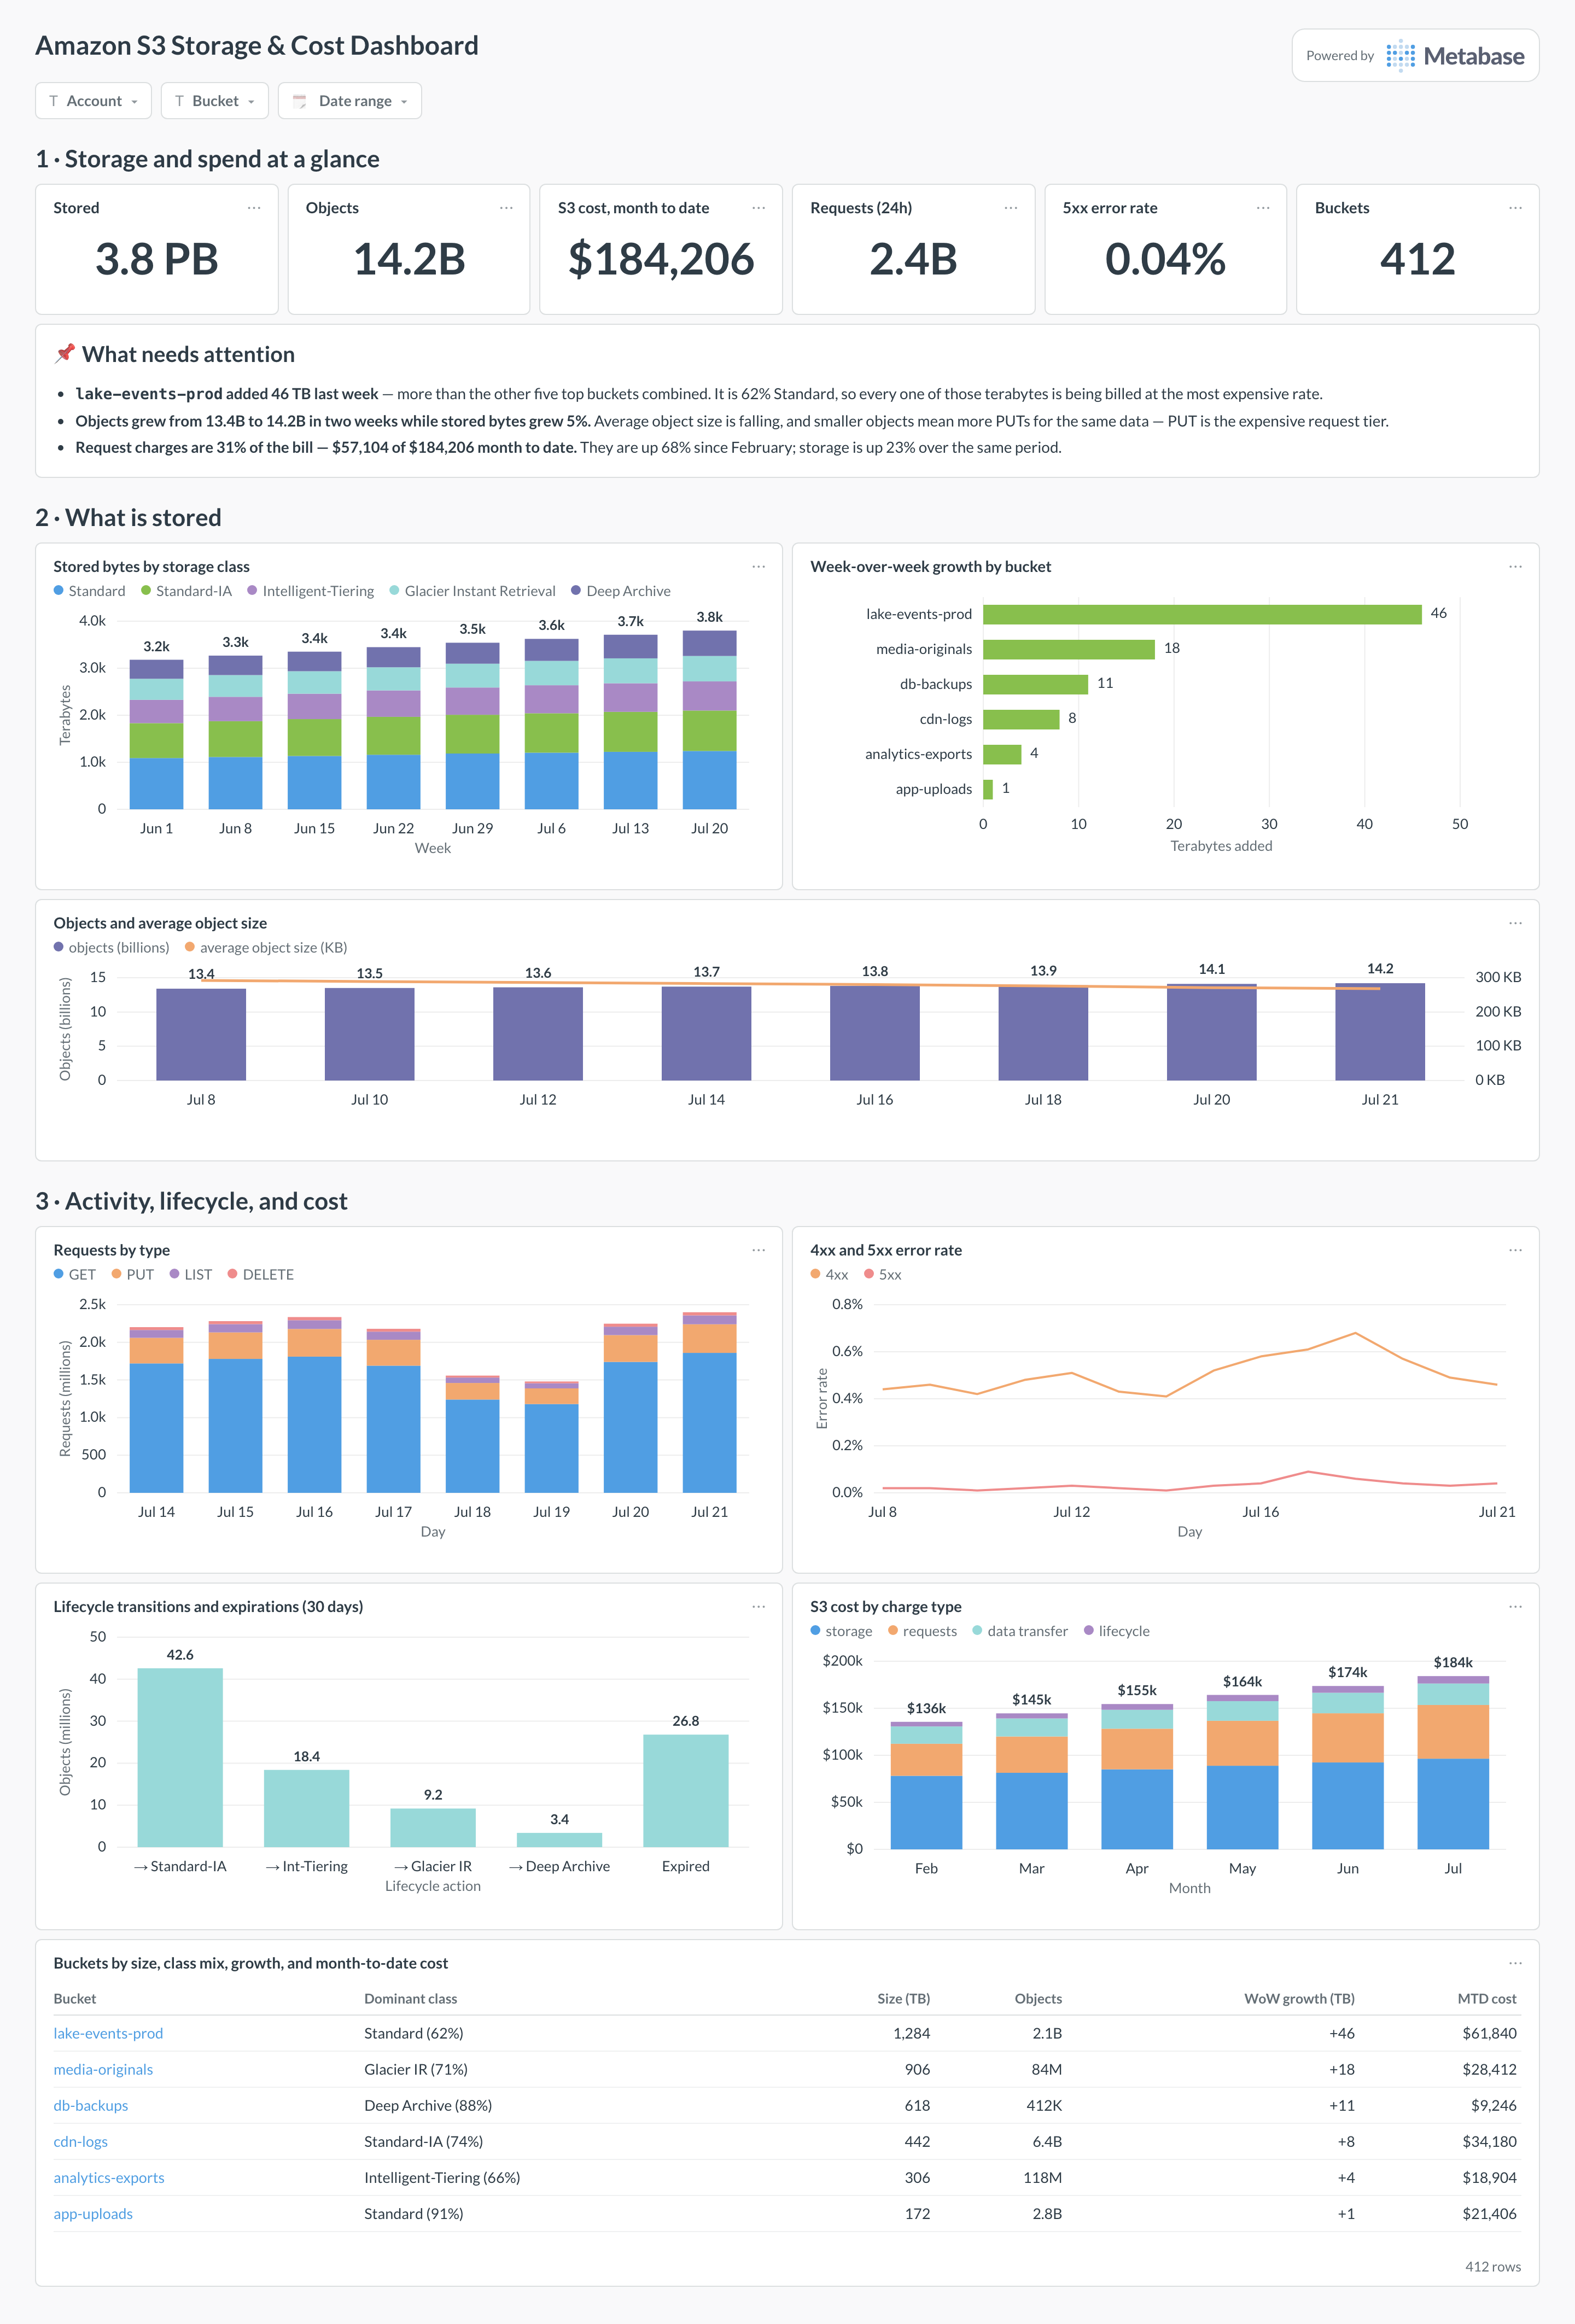
Here’s the layout this guide builds. Totals and month-to-date spend sit at the top; the middle section is storage — how much, in which class, growing how fast, and in how many objects; the bottom section is activity and money, where requests, errors, lifecycle transitions, and cost per bucket explain the bill.
Which cards belong on an S3 storage and cost dashboard?
Eight cards. Four describe the storage, four follow the money — and the pair that matters most is growth beside cost per bucket, because that is where a slow leak becomes a line item.
- Stored bytes by storage class over time (stacked bar)
- Week-over-week growth by bucket (row)
- Objects and average object size per day (combo)
- Requests by type — GET, PUT, LIST, DELETE (stacked bar)
- 4xx and 5xx error rate per day (line)
- Lifecycle transitions and expirations by target class (bar)
- Cost by charge type — storage, requests, transfer, lifecycle (stacked bar)
- Buckets by size, class mix, growth, and month-to-date cost (table)
What data does the dashboard need?
- CloudWatch
BucketSizeBytesandNumberOfObjects— daily, free, and dimensioned byStorageType(StandardStorage,StandardIAStorage,IntelligentTieringFAStorage,GlacierInstantRetrievalStorage,DeepArchiveStorage, and the rest). - CloudWatch request metrics per bucket —
GetRequests,PutRequests,ListRequests,DeleteRequests,4xxErrors,5xxErrors,BytesDownloaded. Opt-in and billed, so enable per bucket. - An S3 Storage Lens daily metrics export for the org-wide class mix, and — on the advanced tier — prefix-level detail, activity metrics, and 15 months of history.
- A Cost and Usage Report with resource IDs enabled, so
line_item_resource_idcarries the bucket ARN andline_item_usage_typeseparatesTimedStorage,Requests-Tier1/Tier2,DataTransfer-Out,Transition, andEarlyDeletecharges. - Optional: S3 Inventory for object-level age and class, which is how you size a lifecycle rule before writing it, and server access logs or CloudTrail data events if you need to know who is doing the requesting.
How do you build it?
- Land the three sources in one place: a scheduled CloudWatch
GetMetricDatapull into a table, the Storage Lens export into a bucket, and the CUR into Athena or your warehouse — then connect that warehouse to Metabase. The AWS billing guide covers the CUR half. - Model bucket identity once. CloudWatch names buckets, the CUR gives ARNs, Storage Lens reports account and region — normalize them to one bucket dimension or no two cards will agree.
- Build the storage-class and cost-by-charge-type cards first. Together they explain most bills, and they are the pair that tells you whether the problem is bytes, requests, or a lifecycle rule.
- Add the growth card as a week-over-week delta rather than a total, and give it a threshold — this is the card that catches versioning with no expiry rule, months before it shows up as a number anyone notices.
- Add filters for account, bucket, and date range, and alert FinOps when a bucket’s weekly growth or month-to-date cost crosses its threshold.
Example card SQL
SELECT
DATE_TRUNC('day', line_item_usage_start_date)          AS day,
SPLIT_PART(line_item_resource_id, ':::', 2)            AS bucket,
SUM(CASE WHEN line_item_usage_type LIKE '%TimedStorage%'
         THEN line_item_unblended_cost END)            AS storage_usd,
SUM(CASE WHEN line_item_usage_type LIKE '%Requests-%'
         THEN line_item_unblended_cost END)            AS requests_usd,
SUM(CASE WHEN line_item_usage_type LIKE '%DataTransfer%'
         THEN line_item_unblended_cost END)            AS transfer_usd,
SUM(CASE WHEN line_item_usage_type LIKE '%Transition%'
          OR line_item_usage_type LIKE '%EarlyDelete%'
         THEN line_item_unblended_cost END)            AS lifecycle_usd,
ROUND(SUM(line_item_unblended_cost), 2)                AS total_usd
FROM cur.aws_billing
WHERE line_item_product_code = 'AmazonS3'
AND line_item_usage_start_date >= DATE_TRUNC('month', CURRENT_DATE)
GROUP BY 1, 2
ORDER BY total_usd DESC;
Related
Metrics
Integrations
Dashboards
FAQ
What is an S3 storage and cost dashboard?
Which source should each card read?
BucketSizeBytes, NumberOfObjects) are free, daily, and broken out by storage type — perfect for the growth cards. CloudWatch request metrics (GetRequests, PutRequests, 4xxErrors, 5xxErrors, FirstByteLatency) are per-minute and accurate but are opt-in and billed per bucket, so enable them where they earn their keep. Storage Lens gives the org-wide class mix, and its advanced tier adds prefix-level detail and 15 months of history through a daily metrics export. The CUR is the only place with actual dollars. Everything else is an estimate.Why is my storage cost higher than size × price?
line_item_usage_type and this is visible immediately: a bucket of small, short-lived objects can spend more on requests and early deletes than on bytes.How do I catch a bucket growing out of control?
What should the lifecycle card tell me?
How do I get cost per bucket at all?
line_item_resource_id then holds the bucket ARN, so grouping by it gives real dollars per bucket. Two caveats worth putting in the card's description: the CUR lands roughly a day behind, so today's number is always incomplete, and cross-account buckets need either a management-account CUR or one report per account unioned together.