Learn about Regressions Open_Closed, including how to measure it, and leverage it in dashboards and visualizations with Metabase.
Regressions open/closed is a method of machine learning model evaluation you can visualize to help understand the performance of your regression model in-depth. There are plenty of metrics you can use to determine the reliability of a model, but regression models require specific metrics to have accurate results. It’s a little more difficult to figure out the accuracy of a regression model as the nature of a regression model differs from how other types of model classification works. It’s always a good idea to figure out the accuracy and integrity of your machine learning, so the extra steps it takes to do so for a regression model is no exception. Looking at how your regression model is fairing in terms of accuracy can help guide improvements, just remember that machine learning is rarely 100% accurate, and don’t fall into the trap of overworking a project. You’ll end up wasting time and energy that way.
Get Started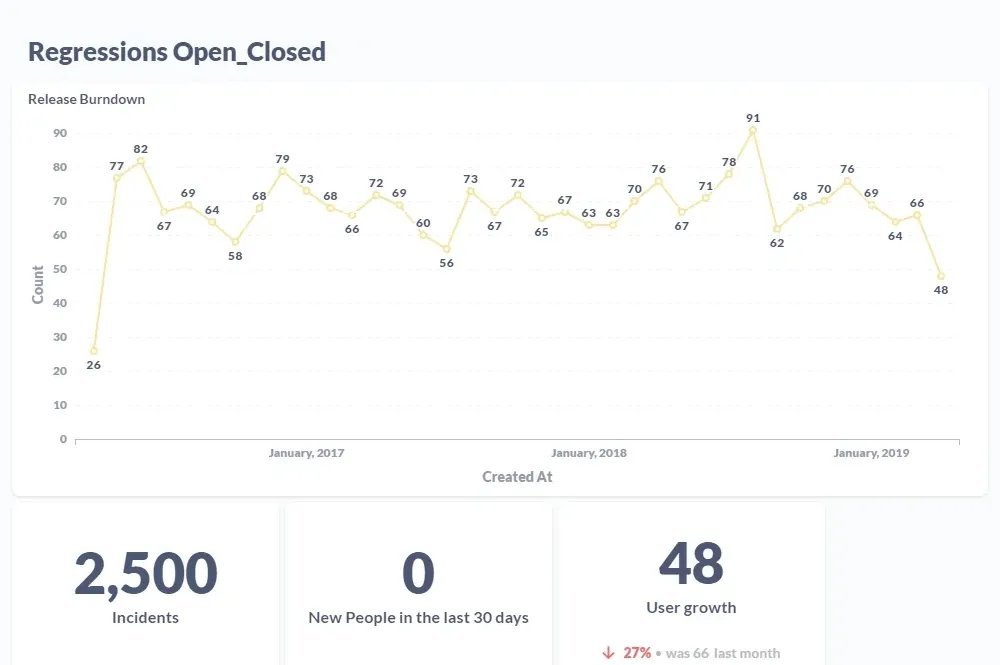
There are a few different regression model calculations that can help determine accuracy. R square/adjusted R square - Explains how much variability from the dependent variable can be explained by the regression model. Mean square error(MSE) - Useful to determine how well a regression model fits dependent variables. Mean absolute error(MAE) - Another calculation similar to MSE, giving a bigger penalization to big prediction errors instead of treating all errors equally. All of these together can help you learn more about how well your regression models are working.
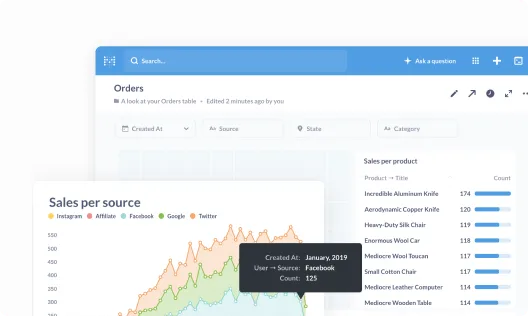
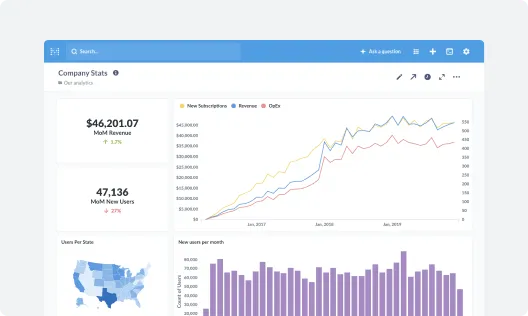
Get everyone on the same page by collecting your most important metrics into a single view.
Take your data wherever it needs to go by embedding it in your internal wikis, websites, and content.
Empower your team to measure their own progress and explore new paths to achieve their goals.

That's right, no sales calls necessary—just sign up, and get running in under 5 minutes.
We connect to the most popular production databases and data warehouses.
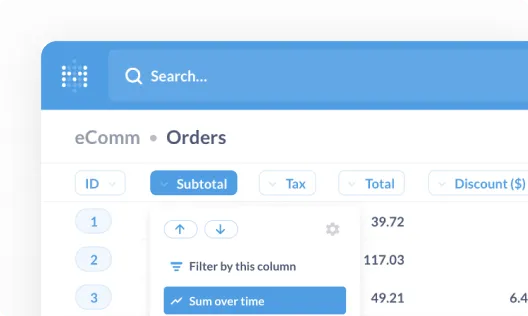
Invite your team and start building dashboards—no SQL required.


