How to Measure Online Application Availability

Learn about Online Application Availability, including how to measure it, and leverage it in dashboards and visualizations with Metabase.

What is Online Application Availability?

Online application availability is a metric used to determine the reliability and stability of a product and whether or not it meets the needs of an end user or organization. The goal of any application is to have the highest availability possible to prevent any stoppage in use. This can include timeouts, DNS errors, and any hiccups overall. It’s important to determine your online application ability to ensure that your networking, backup data, and processing are all working together to ensure that your product is online at all times.

Get Started
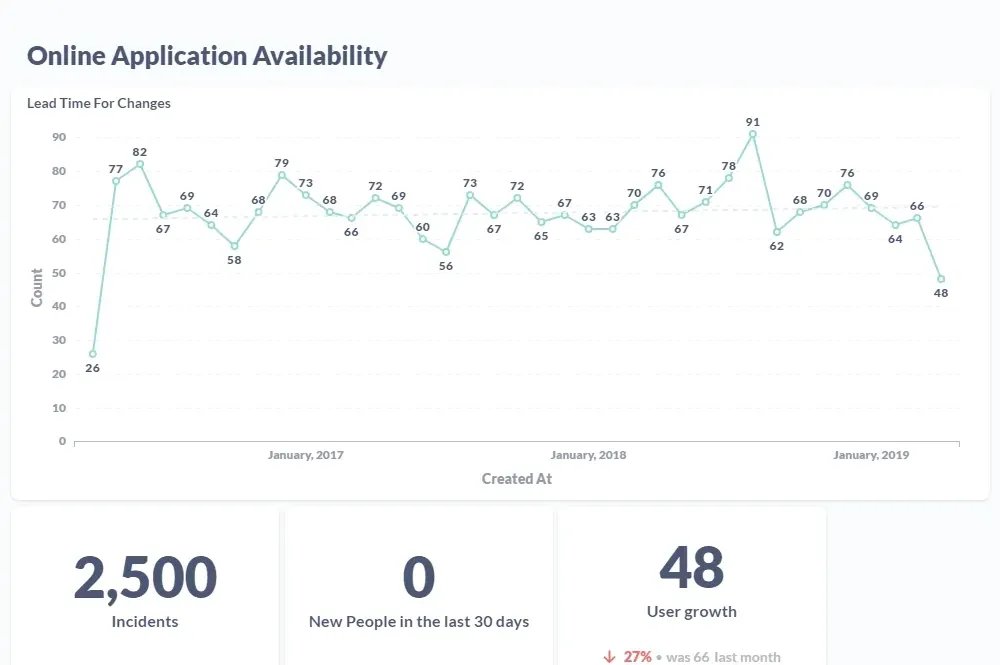
Graphs of Online Application Availability

How to calculate Online Application Availability

You can visualize online application availability by taking your total time experiencing errors and dividing that by a specified amount of time. For example, if you had 5 errors in 250 hours, that would be 98% online application availability. Your application would be fully available 98% of the time.
Other KPIs to measure related to Online Application Availability

  • Lead Time For Changes — how long a commit takes to reach production.
  • Uptime — the percentage of time a service is available; the baseline reliability metric.
  • Error Rate — failed events over total requests, sessions, or users per window.
  • Cost of New Development — what net-new feature work costs per period, set against maintenance and rework.
  • Mean Time Between Failure — average operating time between failures; the reliability counterpart to MTTR.
  • Online Application Performance — response times and throughput as users actually experience them in production.
  • Time to Value — how quickly new customers reach their first meaningful outcome.
  • Build Time — how long builds and CI pipelines take end to end; slow builds drag every feedback loop.
  • Recovery Point Objective — the maximum data loss a recovery can tolerate, measured against actual backup cadence.

Why build a dashboard for Online Application Availability?

Sales per source graph

Everything in one place

Get everyone on the same page by collecting your most important metrics into a single view.
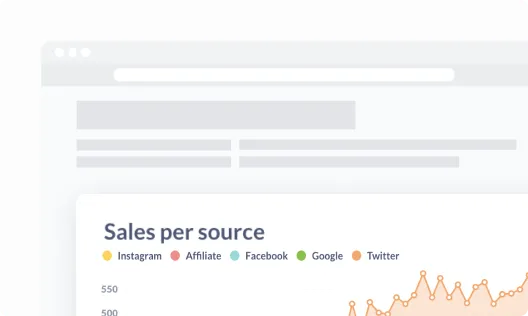
Sales per source graph

Share your perspective

Take your data wherever it needs to go by embedding it in your internal wikis, websites, and content.
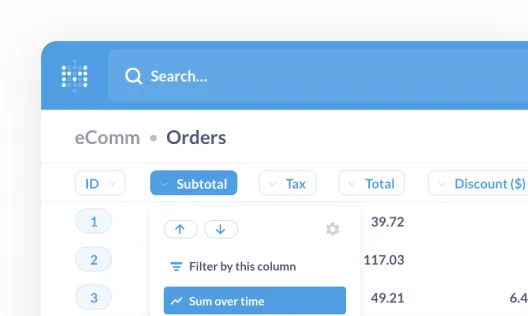
eCommerce orders filter

Unlock exploration

Empower your team to measure their own progress and explore new paths to achieve their goals.

How to use Metabase to measure Online Application Availability

Get started

Step 1.
Skip the custom quote

That's right, no sales calls necessary—just sign up, and get running in under 5 minutes.

types of databases

Step 2.
Plugin your database

We connect to the most popular production databases and data warehouses.
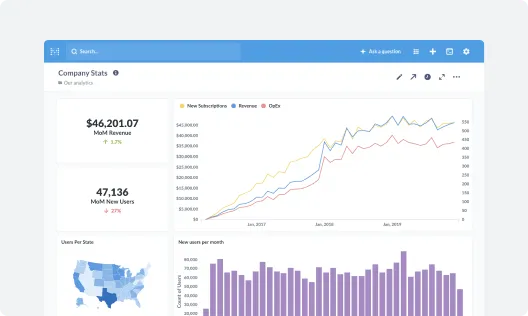
dashboard example

Step 3.
Build your KPI dashboards

Invite your team and start building dashboards—no SQL required.

Get started with Metabase

  • Free, no-commitment trial
  • Easy for everyone—no SQL required
  • Up and running in 5 minutes