How to Measure Service Line Health Impact

Learn about Service Line Health Impact, including how to measure it, and leverage it in dashboards and visualizations with Metabase.

What is Service Line Health Impact?

Your service line health impact is a multi-faceted metric that helps you visualize customer satisfaction based on things like abandoned calls, NPS, issue resolution time, and more. The purpose of this metric is to look at a few pieces of your customer service story at once in order to make correlations between the numbers and your customer happiness. Customer experience is everything, without happy customers, you wouldn’t have an organization, so seeing each part of this metric moving together helps you learn more about things you can improve on.

Get Started
Graphs of Service Line Health Impact

How to calculate Service Line Health Impact

You can create a line graph comparing multiple metrics at once to see your service line health impact using some of the following metrics: NPS - Your net promoter score. This is based on customer ratings of your service, it’s commonly asked after customer support assists you with an issue. Abandoned call rate - How many of your customer service calls are ended prematurely? This is an indication of dissatisfaction. Issue resolution time - How long did it take to come to a resolution? Response time - How long did it take for a customer to get a response? You might notice that the “health” of your service line isn’t good when you line these up. Maybe your response times are good, but your issue resolution times aren’t, leading to poor NPS and abandoned calls.

Other KPIs to measure related to Service Line Health Impact

  • Regressions Open/Closed
  • Release Burndown
  • Security Vulnerabilities
  • Soak Testing
  • Static Code Analysis
  • Time to Patch
  • Velocity
  • Application Change Time
  • Application Monitoring

Why build a dashboard for Service Line Health Impact?

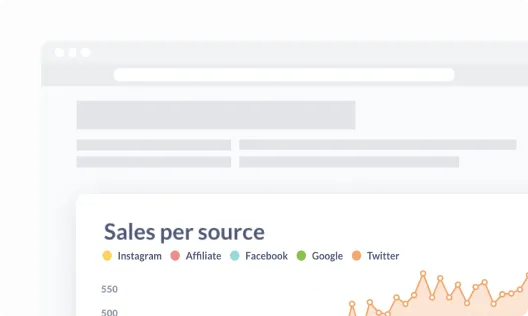
Sales per source graph

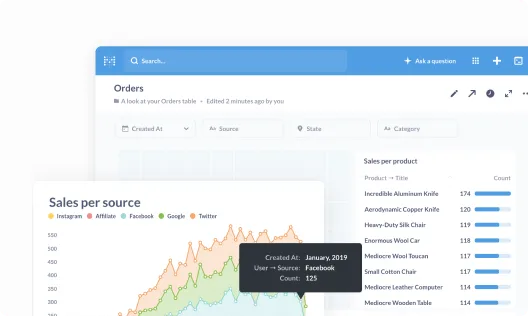
Everything in one place

Get everyone on the same page by collecting your most important metrics into a single view.

Sales per source graph

Share your perspective

Take your data wherever it needs to go by embedding it in your internal wikis, websites, and content.

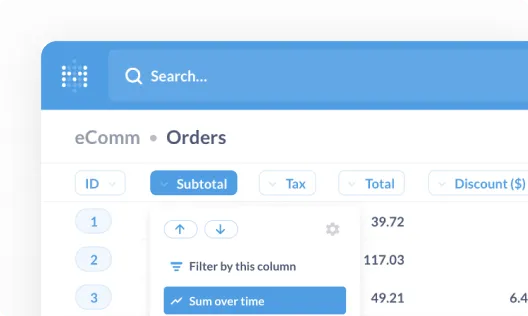
eCommerce orders filter

Unlock exploration

Empower your team to measure their own progress and explore new paths to achieve their goals.

How to use Metabase to measure Service Line Health Impact

Get started

Step 1.
Skip the custom quote

That's right, no sales calls necessary—just sign up, and get running in under 5 minutes.

types of databases

Step 2.
Plugin your database

We connect to the most popular production databases and data warehouses.

dashboard example

Step 3.
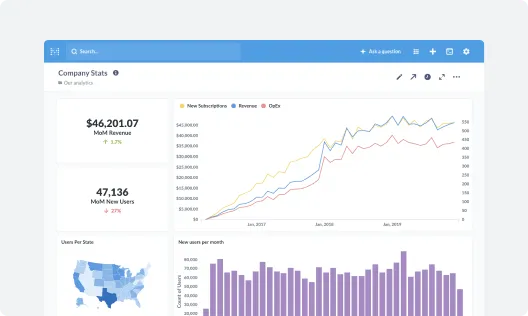
Build your KPI dashboards

Invite your team and start building dashboards—no SQL required.

Get started with Metabase

  • Free, no-commitment trial
  • Easy for everyone—no SQL required
  • Up and running in 5 minutes