Learn about Change Failure Rate, including how to measure it, and leverage it in dashboards and visualizations with Metabase.
Change failure rate is a percentage that represents how often deployments result in failure, leading to a change that needs to be made. This is a DevOps metric that allows teams to visualize inefficiencies in their current flow and consider how these changes might result in downtime with a product or service. The end goal of any development project is to deploy a stable product in a timely manner, but that can become difficult to balance. Learning about what your change failure rate looks like can highlight a need to slow down or make other changes in order to increase product stability and reduce downtime as a result of patches or other fixes needed.
Get Started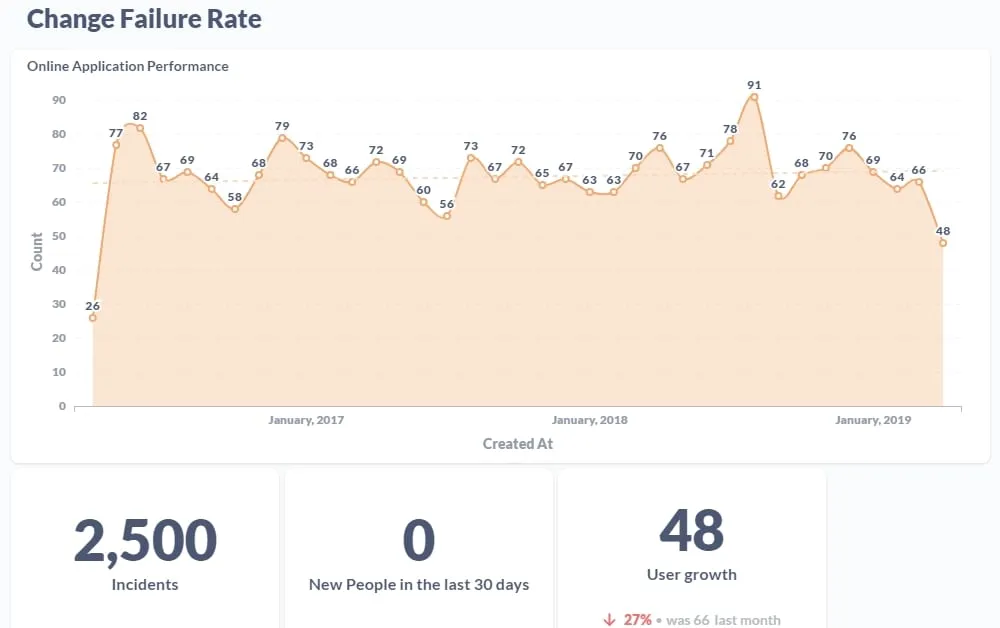
Change failure rates only require that you know the number of deployments that lead to failures and the total number of deployments. You’ll just divide the number of failures with the total. For example, if you’ve done 10 deployments in a given time and 2 resulted in failure, you would divide 2 by 10, giving you 20%.
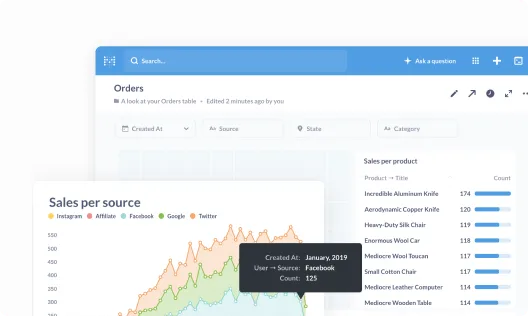
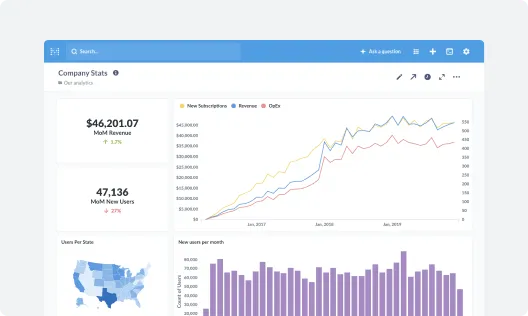
Get everyone on the same page by collecting your most important metrics into a single view.
Take your data wherever it needs to go by embedding it in your internal wikis, websites, and content.
Empower your team to measure their own progress and explore new paths to achieve their goals.

That's right, no sales calls necessary—just sign up, and get running in under 5 minutes.

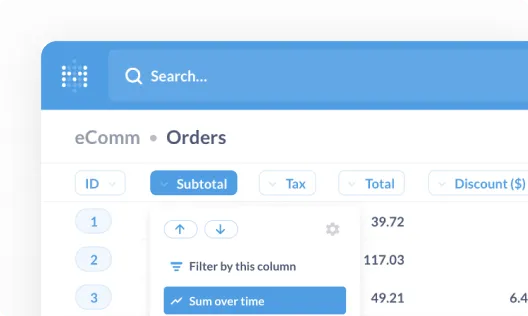
We connect to the most popular production databases and data warehouses.
Invite your team and start building dashboards—no SQL required.


