Learn about Velocity, including how to measure it, and leverage it in dashboards and visualizations with Metabase.
Velocity is a measurement that helps teams visualize the average completion rate of user stories to predict the speed that sprints should be completed in the future. Velocity is a subjective measure, but it still serves the purpose to set realistic expectations when teams are doing a sprint. You should use velocity wisely, however. Attempting to increase your velocity by force can create mistrust in your teams, leading to unhappy developers. Since you’re measuring time vs effort, you’ll need to be conscious that not every sprint is the same. Every situation is unique and your developers aren’t robots, so don’t make it a habit to use velocity as a way to set goals.
Get Started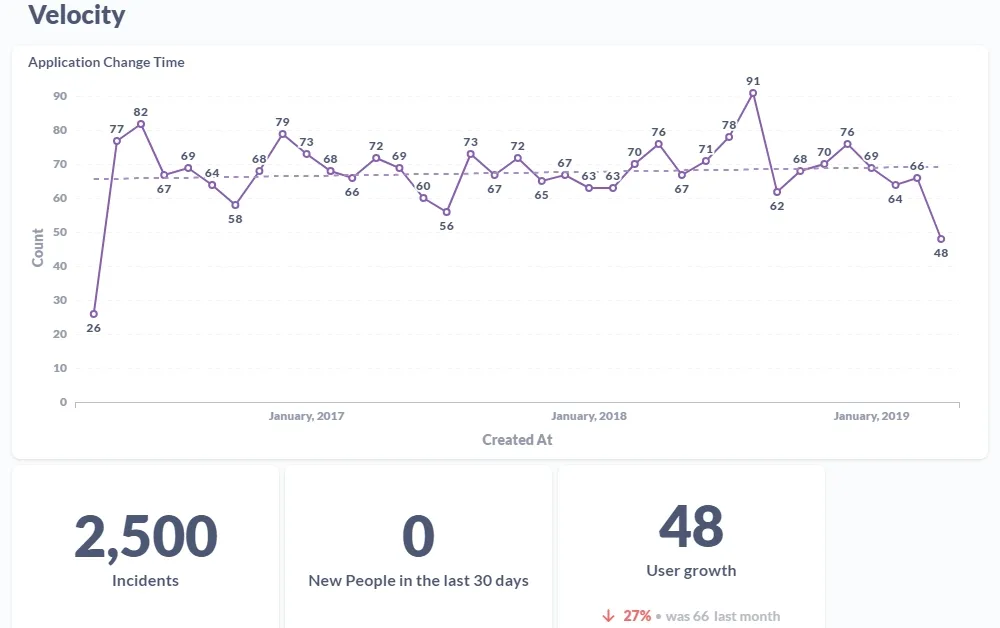
To determine velocity, you’ll make a flow chart showing the relationship between your story points and your sprint times. Essentially, you’re comparing your team’s time to their effort. You want to make a visible timeline of previous sprints so that you can easily begin to notice patterns.
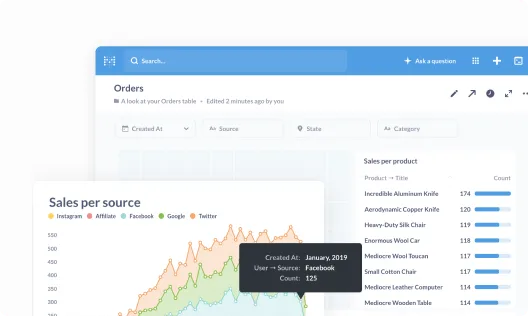
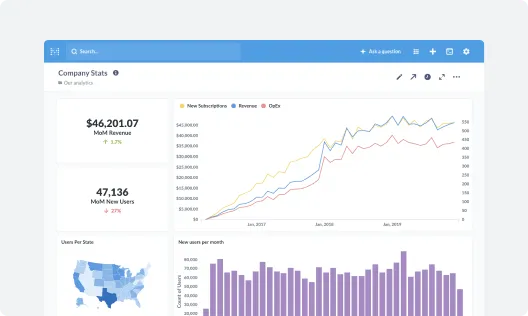
Get everyone on the same page by collecting your most important metrics into a single view.
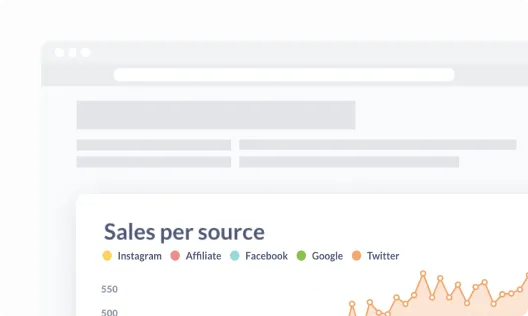
Take your data wherever it needs to go by embedding it in your internal wikis, websites, and content.
Empower your team to measure their own progress and explore new paths to achieve their goals.

That's right, no sales calls necessary—just sign up, and get running in under 5 minutes.

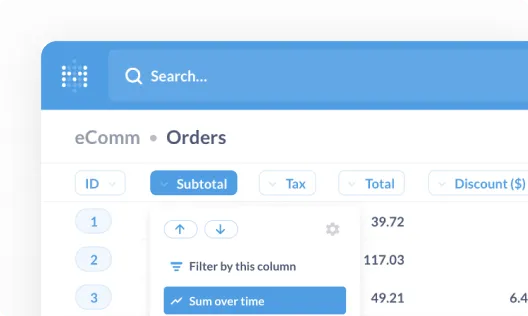
We connect to the most popular production databases and data warehouses.
Invite your team and start building dashboards—no SQL required.


