Learn about Online Application Performance, including how to measure it, and leverage it in dashboards and visualizations with Metabase.
Online application performance is a unique metric used to give a general indication of user satisfaction based on product performance. In essence, you’ll be figuring out a standard for what your service response time should be and what’s considered “good”. Without direct end-user feedback, online application performance metrics can tell you how your products are working when in use. You can customize your calculations to be based on specific features are performing and an overall systemic look at how things are moving. This metric is especially useful to look at performance. It won’t be perfect for every single service you provide, but for programs requiring a high volume of input and output, this is an excellent choice.
Get Started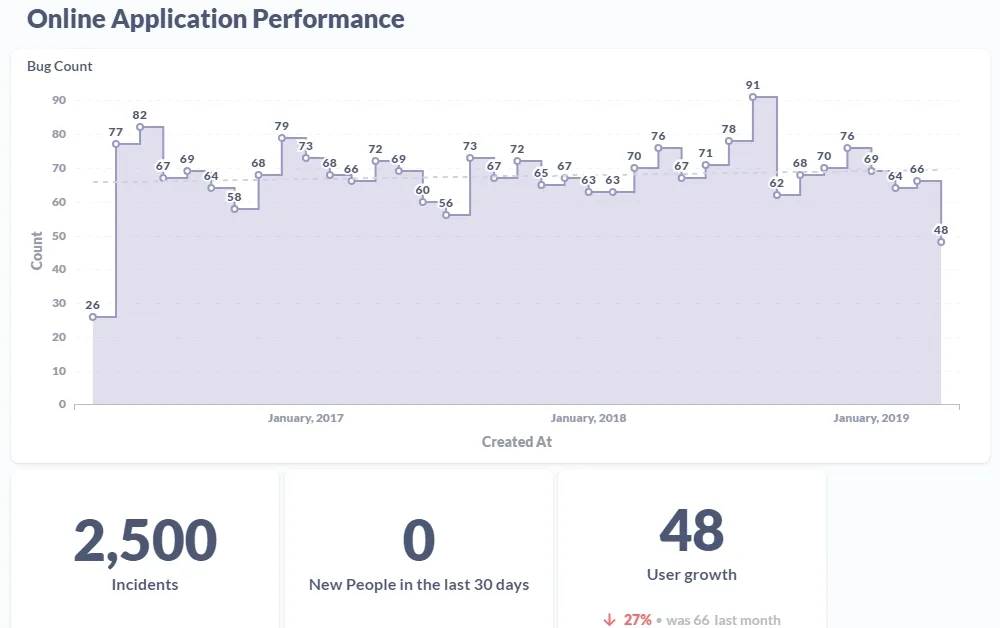
Online application performance is measured as an index number between 1 and 0 in what’s called an apdex score. Calculating your online application performance starts with determining what a good response time is for your program through testing. We’ll say for the purpose of creating an example that 1s or faster is a good response time for your product. Then, we’ll determine that an acceptable range would be anywhere from 1s to 4s. Anything higher than a 4s response time will be considered bad. Now to get your online application performance score, you have to take your test samples and count them by good, acceptable, and bad. You’ll take all of the good scores counted and half of the acceptable scores counted, and then divide them by the total number of samples taken. For example, let’s say you did 400 tests and 160 were good, 120 were acceptable, and the rest were bad. First, you would split the acceptable tests in half to get 60, then add them to the 160 good tests to get 220. Then, you would divide 220 by 400 for an apdex score of 0.55. The closer to 1, the better, so this apdex score isn’t great, but it shows you where you’re at so you can adjust your current methods.
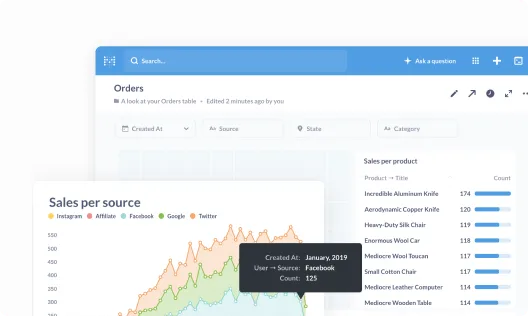
Get everyone on the same page by collecting your most important metrics into a single view.
Take your data wherever it needs to go by embedding it in your internal wikis, websites, and content.
Empower your team to measure their own progress and explore new paths to achieve their goals.

That's right, no sales calls necessary—just sign up, and get running in under 5 minutes.

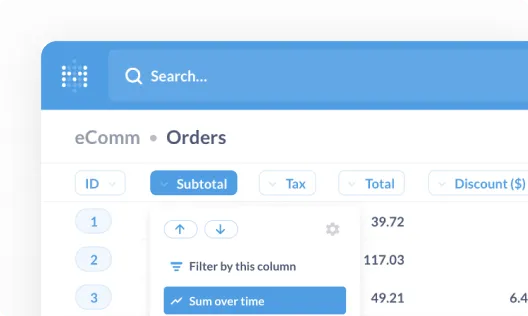
We connect to the most popular production databases and data warehouses.
Invite your team and start building dashboards—no SQL required.


