Learn about Code Simplicity, including how to measure it, and leverage it in dashboards and visualizations with Metabase.
Code simplicity covers a number of different measurements. As a general rule of thumb, most people involved in software engineering understand that having clean code is essential. Code simplicity can tell you more about how efficient code being written is. Being able to measure code simplicity can help you learn more about the efficiency of code in a variety of ways depending on your specific needs.
Get Started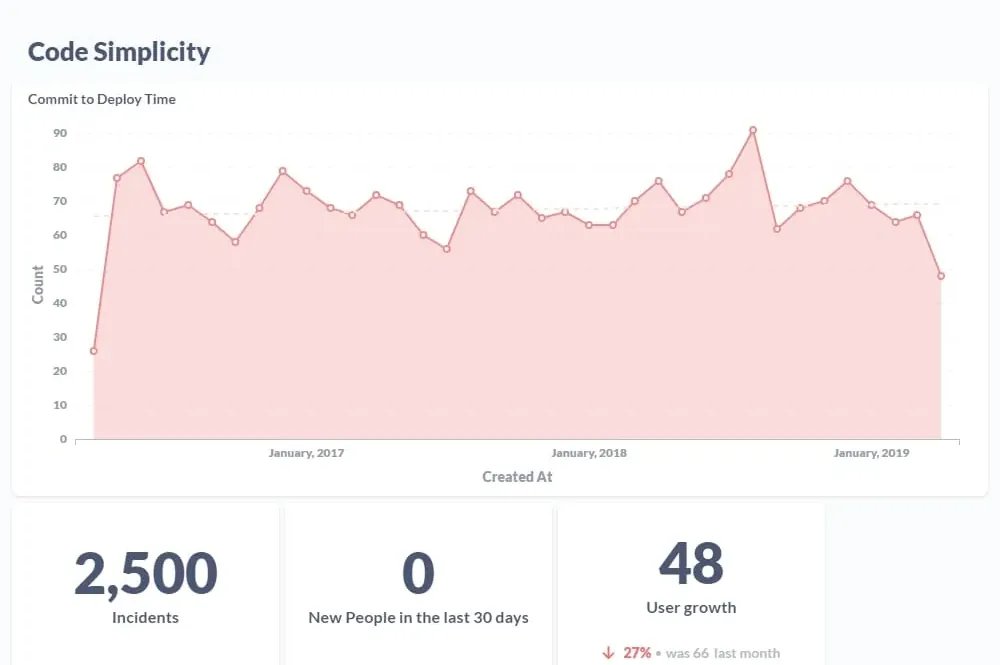
Typically code simplicity is calculated with different tests for different things. For example, you can test for cyclomatic complexity, which is a test that measures the number of independent paths a code must take in order to complete a task. You should also use code simplicity for risk assessment. Areas with complicated code can be more prone to bugginess and lessen reliability. One of the biggest facets of assessing code simplicity is peer review. Allowing teams to help each other with code can help others get on the same page and work more efficiently. This can help with onboarding new employees as well.
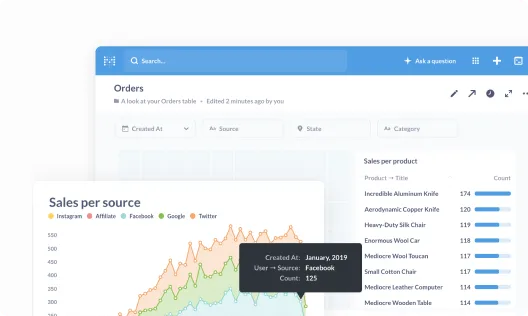
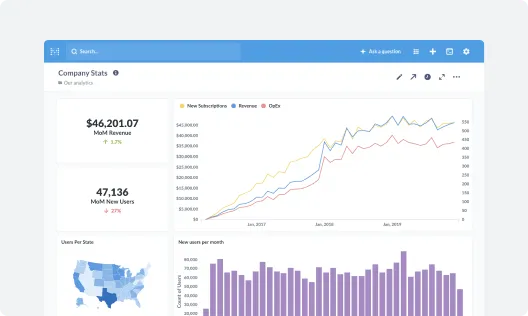
Get everyone on the same page by collecting your most important metrics into a single view.
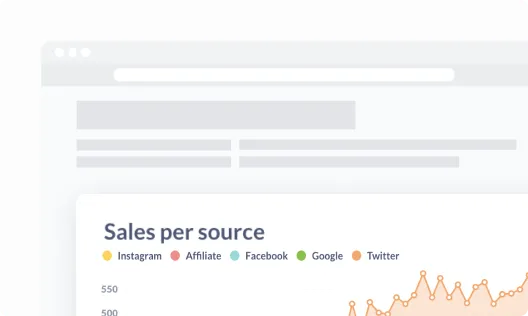
Take your data wherever it needs to go by embedding it in your internal wikis, websites, and content.
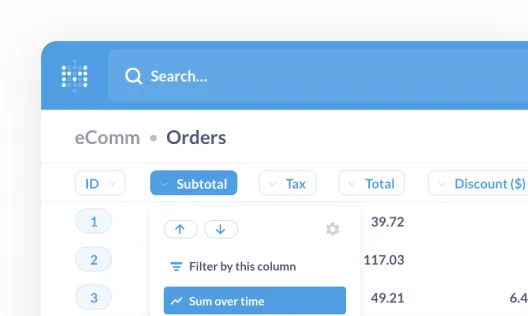
Empower your team to measure their own progress and explore new paths to achieve their goals.

That's right, no sales calls necessary—just sign up, and get running in under 5 minutes.

We connect to the most popular production databases and data warehouses.
Invite your team and start building dashboards—no SQL required.




