Dashboards for Apache Hive

Metabase makes it easy for everyone to build a dashboard for Apache Hive.

What’s a Apache Hive dashboard?

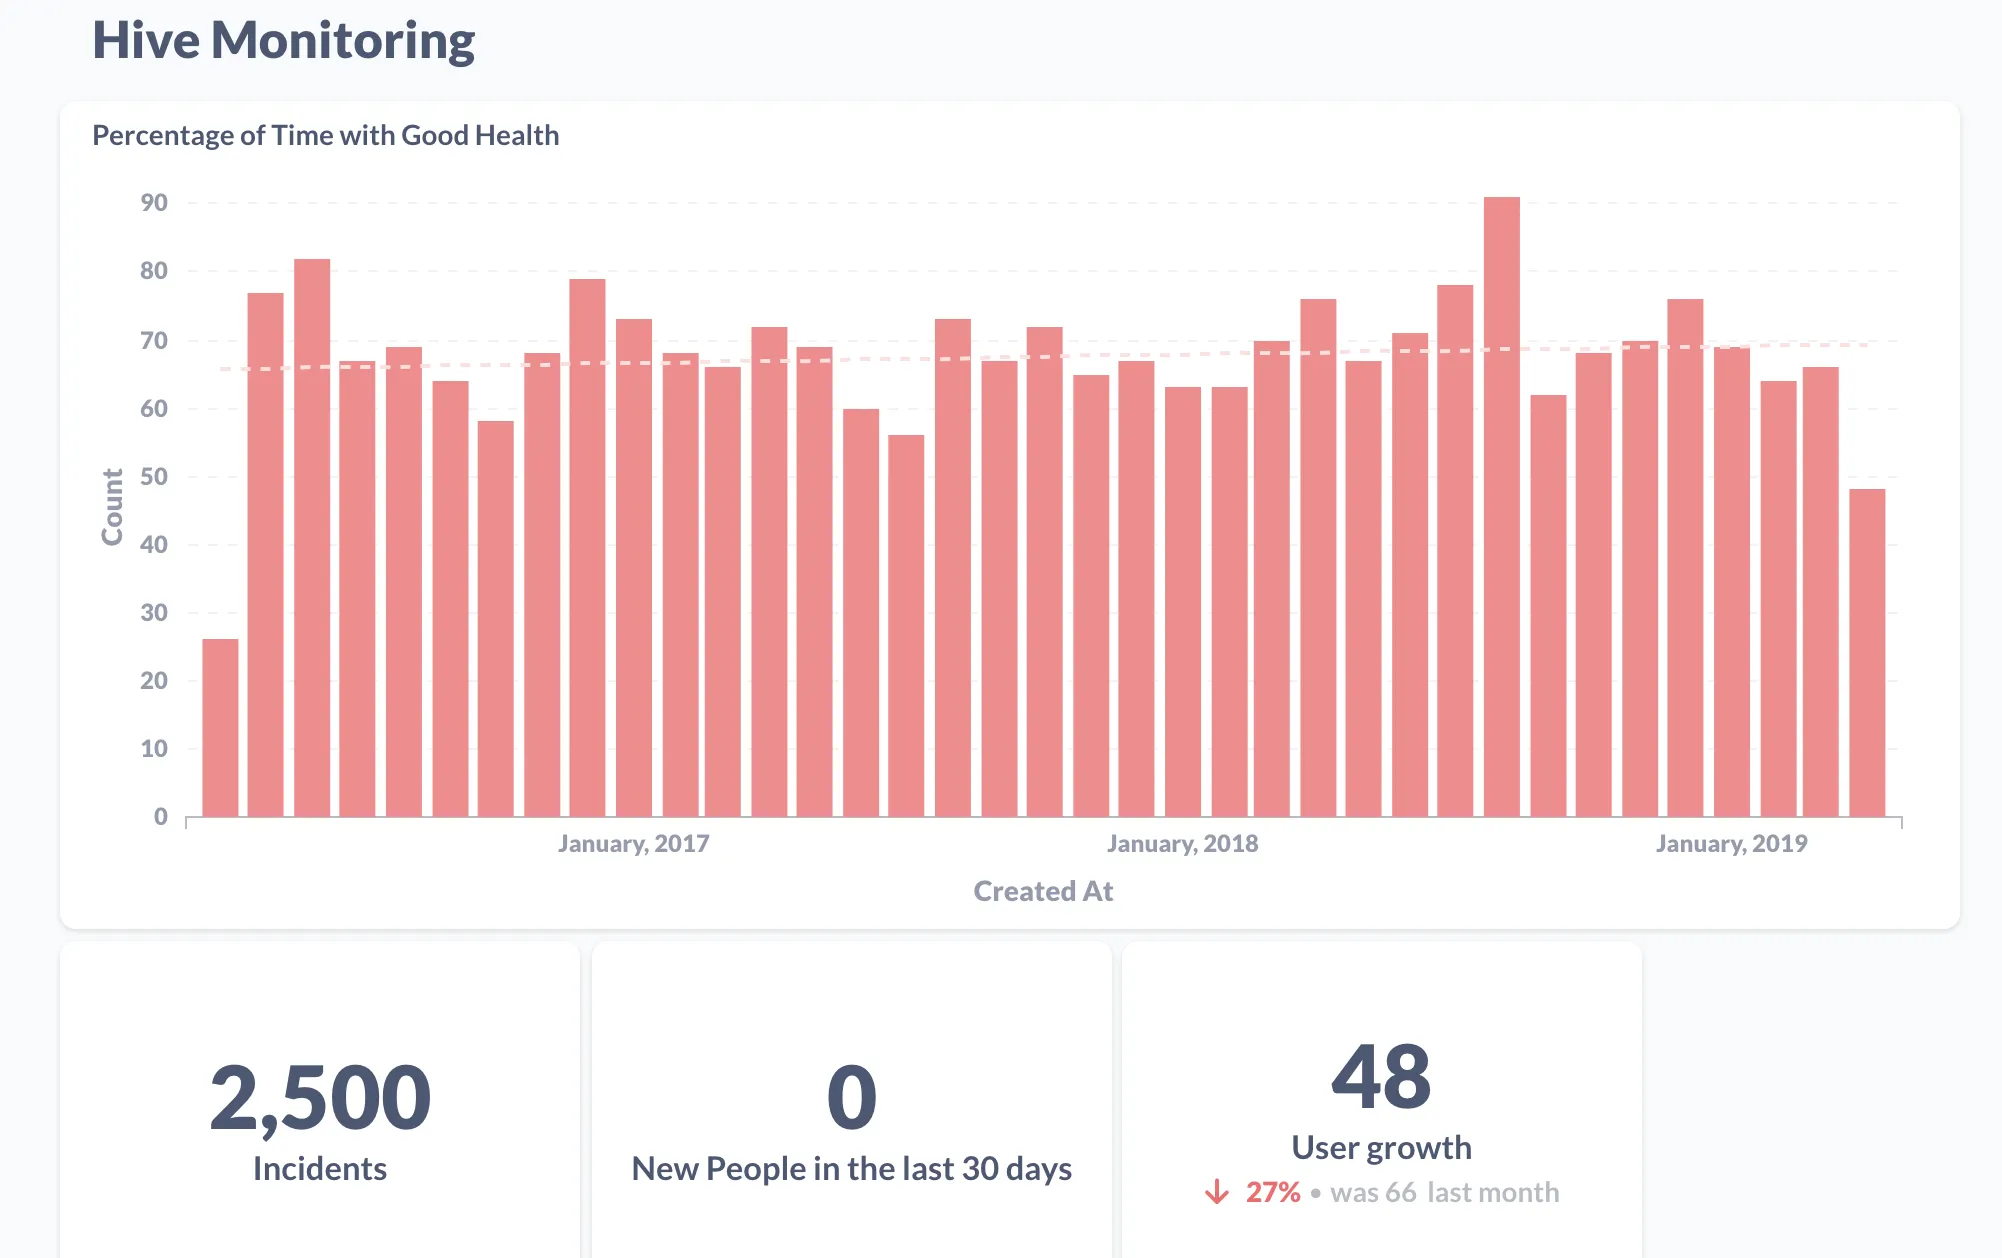
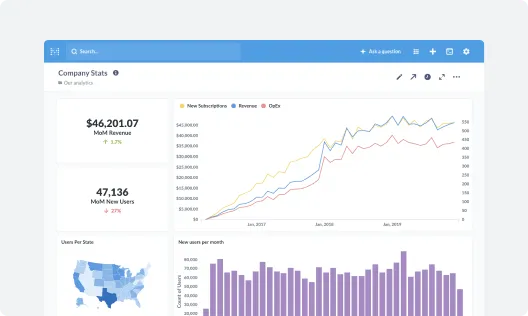
A dashboard for monitoring Apache Hive's data warehouse system. This dashboard allows developers to understand and visualize the health of their data.

Get Started
Graphs of Apache Hive

Why build a dashboard for Apache Hive?

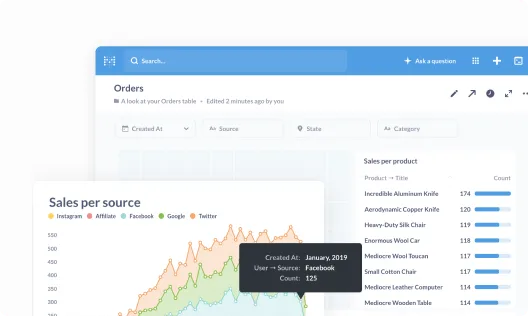
Sales per source graph

Everything in one place

Get everyone on the same page by collecting your most important metrics into a single view.

Sales per source graph

Share your perspective

Take your data wherever it needs to go by embedding it in your internal wikis, websites, and content.

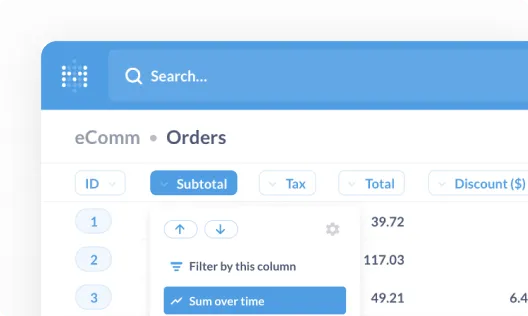
eCommerce orders filter

Unlock exploration

Empower your team to measure their own progress and explore new paths to achieve their goals.

What should I track on my dashboard for Apache Hive?

Every team is different, but sometimes it helps to start with some examples. Here are our top 8 Apache Hive metrics to start tracking on your dashboards.

Top 8 Apache Hive monitoring metrics

  • Number of alerts and critical events
  • Percentage of time with bad health
  • Percentage of time with concerning health
  • Percentage of time with good health
  • Rate of execution
  • API calls
  • HiveServer2 open client sessions
  • Number of queries submitted

How to use Metabase to build Apache Hive dashboards

Get started

Step 1.
Skip the custom quote

That's right, no sales calls necessary—just sign up, and get running in under 5 minutes.

types of databases

Step 2.
Plugin your database

We connect to the most popular production databases and data warehouses.

dashboard example

Step 3.
Build your dashboards

Invite your team and start building dashboards—no SQL required.

Get started with Metabase

  • Free, no-commitment trial
  • Easy for everyone—no SQL required
  • Up and running in 5 minutes