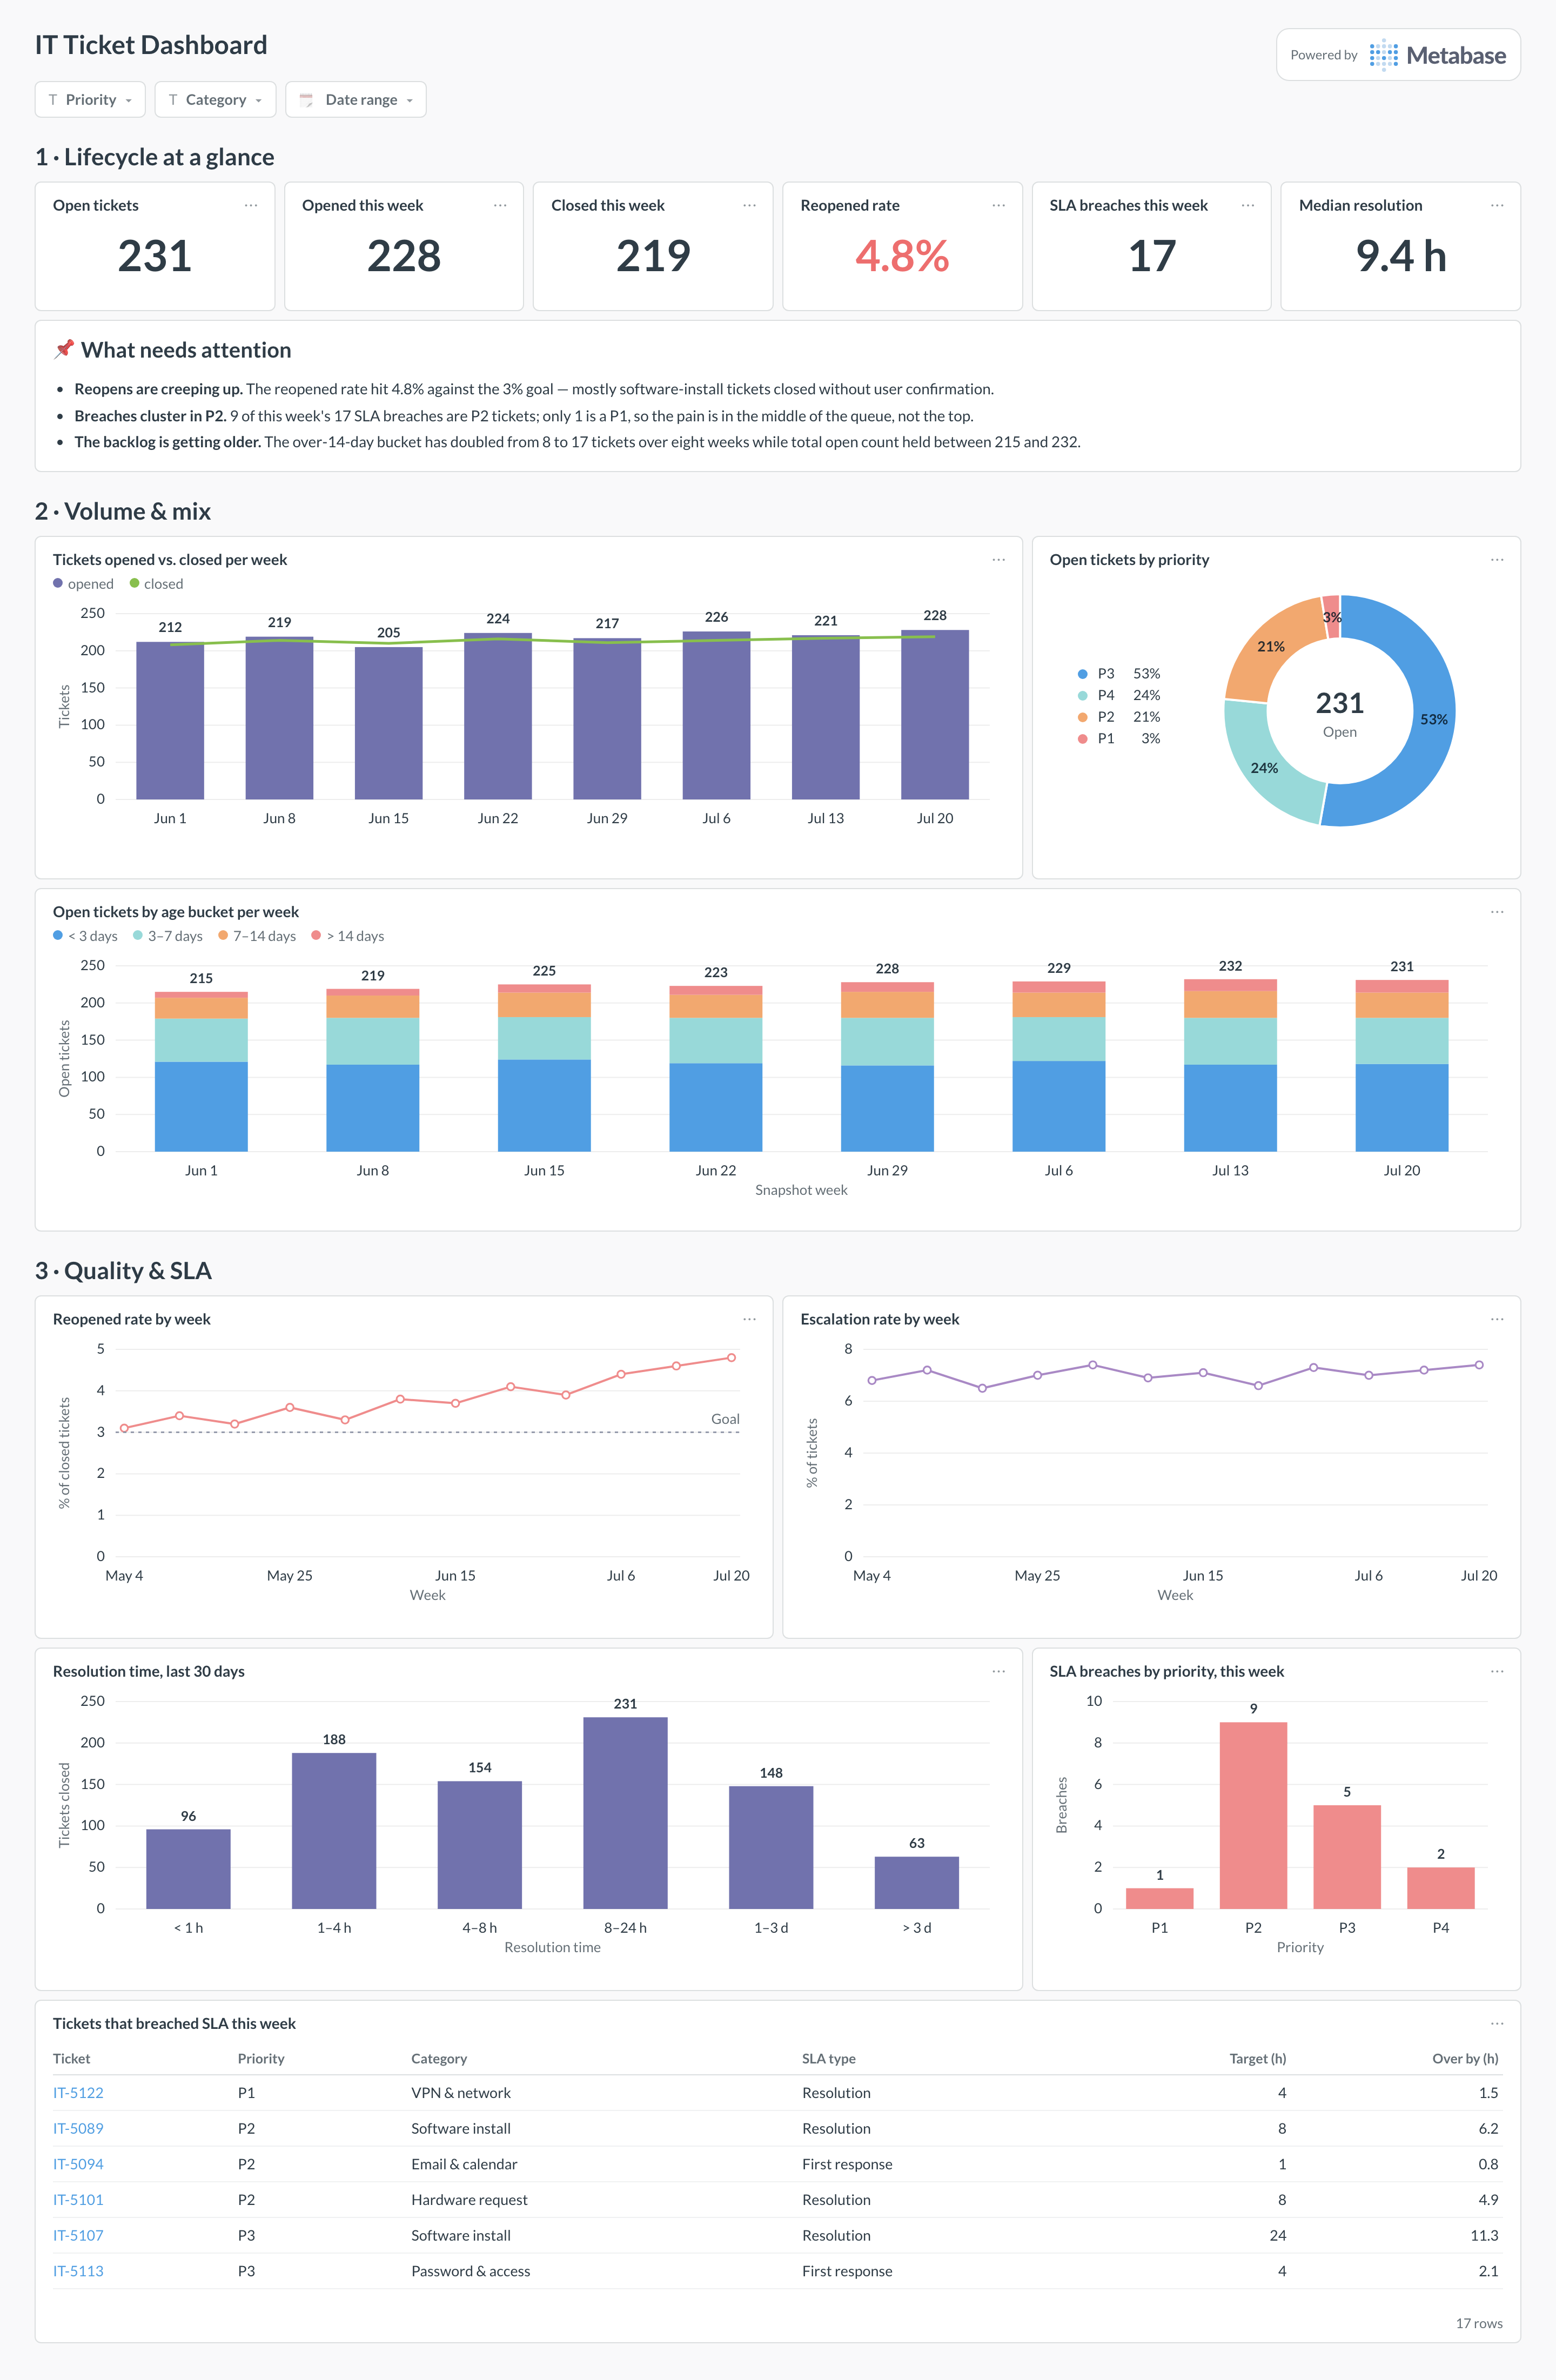
An IT ticket dashboard follows the tickets themselves through their lifecycle: how volume trends, how the backlog ages, how often closed tickets bounce back, where escalations and SLA breaches concentrate, and what resolution time really looks like as a distribution. Metabase builds it from the ticket and status-history tables of Jira, Zendesk, or Freshdesk, synced to a warehouse.
For: help-desk leads and IT analysts who own ticket quality.
Grain: one row per ticket, plus its status transitions. Refresh: daily, with a scheduled backlog snapshot for the aging trend.
What does an IT ticket dashboard look like?
Here’s the layout this guide builds. The lifecycle’s headline numbers sit at the top. Volume and mix come next — intake versus closes, the priority split, and how the open backlog’s age profile has shifted. Quality and SLA close the page: reopened and escalation rates, where resolution time actually lands, which priorities are breaching, and the specific tickets that breached this week.
An example IT ticket dashboard in Metabase, built from ticket and status-history tables. Figures are illustrative.
Which cards belong on an IT ticket dashboard?
The eight below trace the lifecycle end to end: arrival, aging, bounce-back, escalation, breach, and how long resolution really takes.
Tickets opened vs. closed per week (combo)
Open tickets by priority (donut)
Open tickets by age bucket per week, from backlog snapshots (stacked bar)
Reopened rate by week against its goal (line)
Escalation rate by week (line)
Resolution-time distribution, past 30 days (bar)
SLA breaches by priority, this week (bar)
Tickets that breached SLA this week (table)
What data does the dashboard need?
A tickets table: ticket_id, priority, category, opened_at, resolved_at, status, and the desk’s SLA due/breach fields.
A ticket_events (status history) table — Jira’s changelog, Zendesk’s audits, Freshdesk’s activities — with ticket_id, from_status, to_status, occurred_at.
Derived lifecycle timestamps per ticket: first_closed_at, reopened_at, escalated_at — computed once from the events table.
A backlog_snapshots table appended daily or weekly: snapshot date, ticket (or age bucket), and age in days — the aging trend cannot be reconstructed later.
An SLA policy reference (target per priority for response and resolution) so breach cards agree with the desk’s own math.
How do you build it?
Sync tickets and the status-history stream from your desk into the warehouse — the lifecycle cards need transitions, not just current state.
Build a Metabase model that derives first_closed_at, reopened_at, and escalated_at per ticket with window functions over the events table.
Schedule the backlog snapshot: one job appending open-ticket ages per day, feeding the aging stacked bar.
Create the quality cards from the model — reopened rate within 7 days of first close, escalation rate per week, and the resolution-time histogram bucketed by hours.
Add filters for priority, category, and date range, and pin the breach table’s filter to the current week so the review always opens on fresh cases.
Example card SQL
Reopened rate by week, 7-day reopen windowPostgreSQL
SELECT
date_trunc('week', t.first_closed_at)::date   AS week,
COUNT(*)                                      AS tickets_closed,
COUNT(*) FILTER (
  WHERE t.reopened_at IS NOT NULL
    AND t.reopened_at
        <= t.first_closed_at + INTERVAL '7 days'
)                                             AS reopened_within_7d,
ROUND(
  100.0 * COUNT(*) FILTER (
    WHERE t.reopened_at IS NOT NULL
      AND t.reopened_at
          <= t.first_closed_at + INTERVAL '7 days'
  ) / COUNT(*), 1
)                                             AS reopened_rate_pct
FROM tickets t
WHERE t.first_closed_at >= CURRENT_DATE - 84
GROUP BY 1
ORDER BY 1;
How is this different from an IT support dashboard?
Same tickets, different subject. An IT support dashboard is about the team — inflow by channel, agent workload, employee satisfaction — and a lead reads it to run the desk day to day. This dashboard is about the tickets themselves: how they age, how often they bounce back, where they breach, how long resolution really takes. It is the view for the analyst or manager asking why the queue behaves the way it does, and its cards need lifecycle timestamps (first close, reopen, escalation) that the team view never touches. Most desks want the support view first and add this one when quality questions start.
What counts as "reopened," and what is a good reopened rate?
Define it as a ticket returning to an open state within a fixed window of its first close — 7 days is the common choice, long enough to catch "this is still broken," short enough to exclude genuinely new occurrences. Compute the rate against tickets closed in the period, not tickets currently open. Healthy internal desks typically sit between 2% and 5%; the level matters less than the mix, because reopens cluster. Group them by category and closing agent before reacting: a rate of 4.8% driven by one category — as in the example above — is a process fix, not a team-wide problem.
Why can't I chart historical backlog aging from the tickets table?
Because the tickets table only knows the present. A ticket that was open and 10 days old in March looks "closed" today, so a query over current status reconstructs today's backlog, not March's — and an aging trend built that way silently rewrites history every night. The fix is a snapshot: a small scheduled job appends one row per open ticket (or per age bucket) daily or weekly, and the aging chart reads from that table. It is ten lines of SQL, and it is the difference between "the over-14-day bucket doubled this quarter" being a fact or a guess.
Should SLA breaches count response SLAs or resolution SLAs?
Track both, on separate cards, because they fail differently. A first-response breach is a staffing or routing problem — nobody looked at the ticket in time. A resolution breach is a complexity or dependency problem — someone looked, and the fix is slow. Blending them into one breach rate hides which lever to pull. Break each out by priority: P1 breaches should be rare enough to review individually, while P3 breaches are a volume statistic. If response-time SLAs are your desk's sore spot, the SLA response time dashboard covers that side in depth.
Why is my resolution-time distribution bimodal?
Because it is really several distributions wearing one histogram. Password resets close in minutes; hardware procurement waits on vendors for days; auto-closed and bulk-resolved tickets pile into whatever bucket the automation lands in. A lump at the far right usually means tickets waiting on third parties with the clock still running, and a spike at zero often means agents resolving at first touch without logging work. Filter the histogram by category before drawing conclusions, and consider pausing the clock on vendor-wait states — otherwise the median is an average of apples and shipping containers.
How should escalations be defined and measured?
Pick one observable event and stick to it — a tier change, a reassignment to a specialist group, or a priority bump — because "escalation" means all three in casual use. Record it as a timestamped event so you can measure both the escalation rate and time-to-escalate. A rising rate is not automatically bad: it can mean tier 1 is correctly refusing to sit on tickets it cannot solve. The pattern to catch is escalations that arrive late — tickets that burned most of their SLA at tier 1 first, which shows up when you chart time-to-escalate against the SLA clock.
What data does lifecycle analysis need that a ticket table lacks?
Status history. The tickets table holds one row per ticket with its current state; lifecycle cards need the transitions — when it was closed the first time, reopened, escalated, or put on hold. Jira exposes this as the changelog, Zendesk as ticket events and audits, Freshdesk as ticket activities; make sure your sync includes that stream, not just the ticket snapshot. Once transitions land in the warehouse, first-close and reopen timestamps are a window function away, and the same history powers the backlog snapshots the aging chart needs.