





What goes in a ticket volume dashboard in Metabase?
A ticket volume dashboard tracks how much work is coming in, how much you're clearing, and what's piling up. It's the capacity and staffing view for support. Build it from support data synced into a database — see Zendesk, Intercom, or Freshdesk for the connection.
For: Support ops, team leads, WFM. Refresh: hourly to daily. Source: modeled tickets with created/resolved timestamps, channel, and tags.
What does a ticket volume dashboard look like?
Here’s the layout this guide builds. Created, solved, and the net flow between them sit at the top, then the intake curve and the created-versus-solved lines that show whether you’re keeping up, then the backlog’s age profile and the channels, queues, and topics generating the work. Read it for staffing and capacity planning.
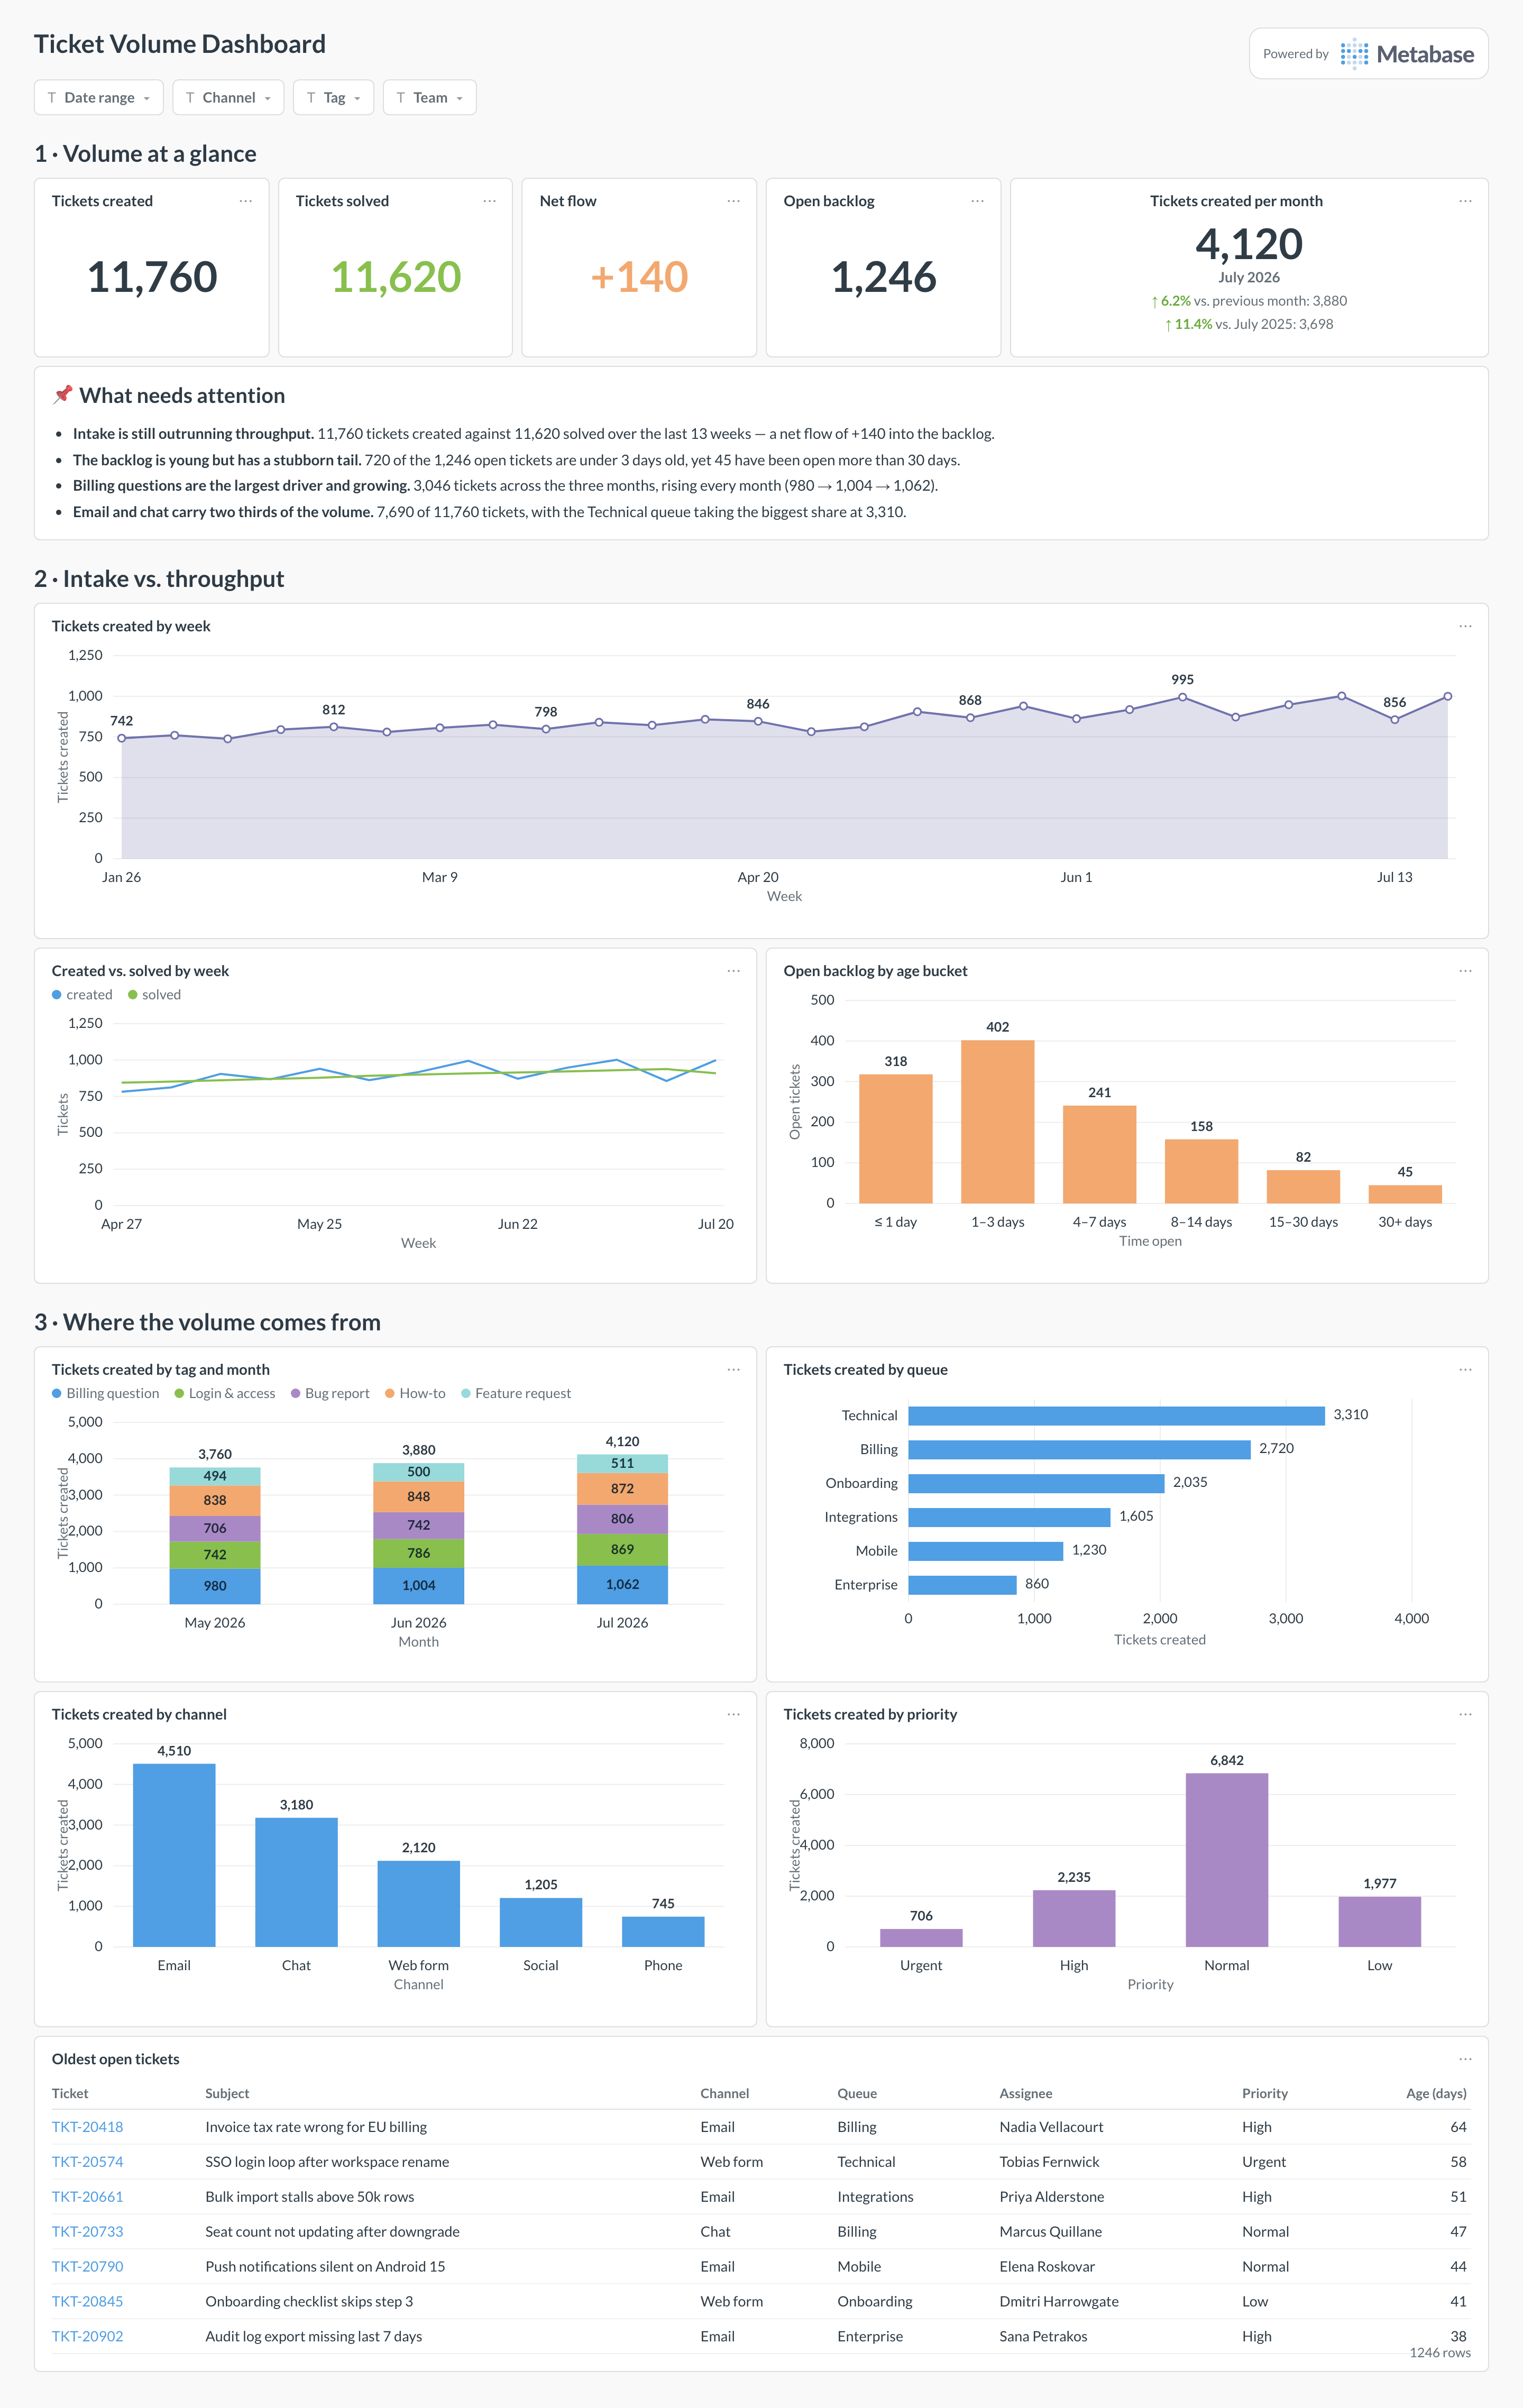
An example ticket volume dashboard in Metabase, built from Zendesk, Intercom, or Freshdesk data. Figures are illustrative.
Which cards belong on a ticket volume dashboard?
Headline KPIs
- Tickets created (this period)
- Tickets solved (this period)
- Net flow (created − solved)
- Open backlog
Trend & breakdown
- Created vs. solved by week
- Backlog by age bucket
- Volume by channel (email, chat, social)
- Volume by tag / topic (drivers)
- Oldest open tickets (table)
What data does a ticket volume dashboard need?
- A
ticketstable withcreated_atandresolved_at. - Channel, tag/topic, and team fields for segmentation.
- A status field if you want backlog to exclude customer-pending tickets.
How do you build a ticket volume dashboard?
- Sync your help desk into a database (Zendesk, Intercom, or Freshdesk).
- Filter out merged, spam, and bot-created tickets so volume is real load.
- Build created-vs-solved and backlog-by-age cards.
- Add filters for channel, tag, team, and date range.
Example card SQL
-- Tickets created vs. solved by week, with net flow.
SELECT
weeks.week,
COUNT(c.id)                        AS created,
COUNT(s.id)                        AS solved,
COUNT(c.id) - COUNT(s.id)          AS net_flow
FROM (
SELECT generate_series(
  date_trunc('week', CURRENT_DATE - INTERVAL '12 weeks'),
  date_trunc('week', CURRENT_DATE),
  INTERVAL '1 week'
) AS week
) weeks
LEFT JOIN tickets c ON date_trunc('week', c.created_at)  = weeks.week
LEFT JOIN tickets s ON date_trunc('week', s.resolved_at) = weeks.week
GROUP BY weeks.week
ORDER BY weeks.week;