





What goes in a support overview dashboard in Metabase?
A support overview dashboard is the exec roll-up for a help desk: how much you're handling, how fast you respond and resolve, and how happy customers are — all in one view. It sits above the per-team and per-agent detail. Build it from support data synced into a database — see Zendesk, Intercom, Front, or Freshdesk for the connection.
For: Support leaders, ops, execs. Refresh: hourly to daily. Source: modeled tickets, messages, and ratings (+ status history for resolution and SLA).
What does a support overview dashboard look like?
Here’s the layout this guide builds. Six headline numbers give the shape of the week, then intake against backlog and the aging of open work, then the speed percentiles and the channel and topic mix underneath. Read it as the standing weekly roll-up, and drill into the per-team dashboards when a number moves.
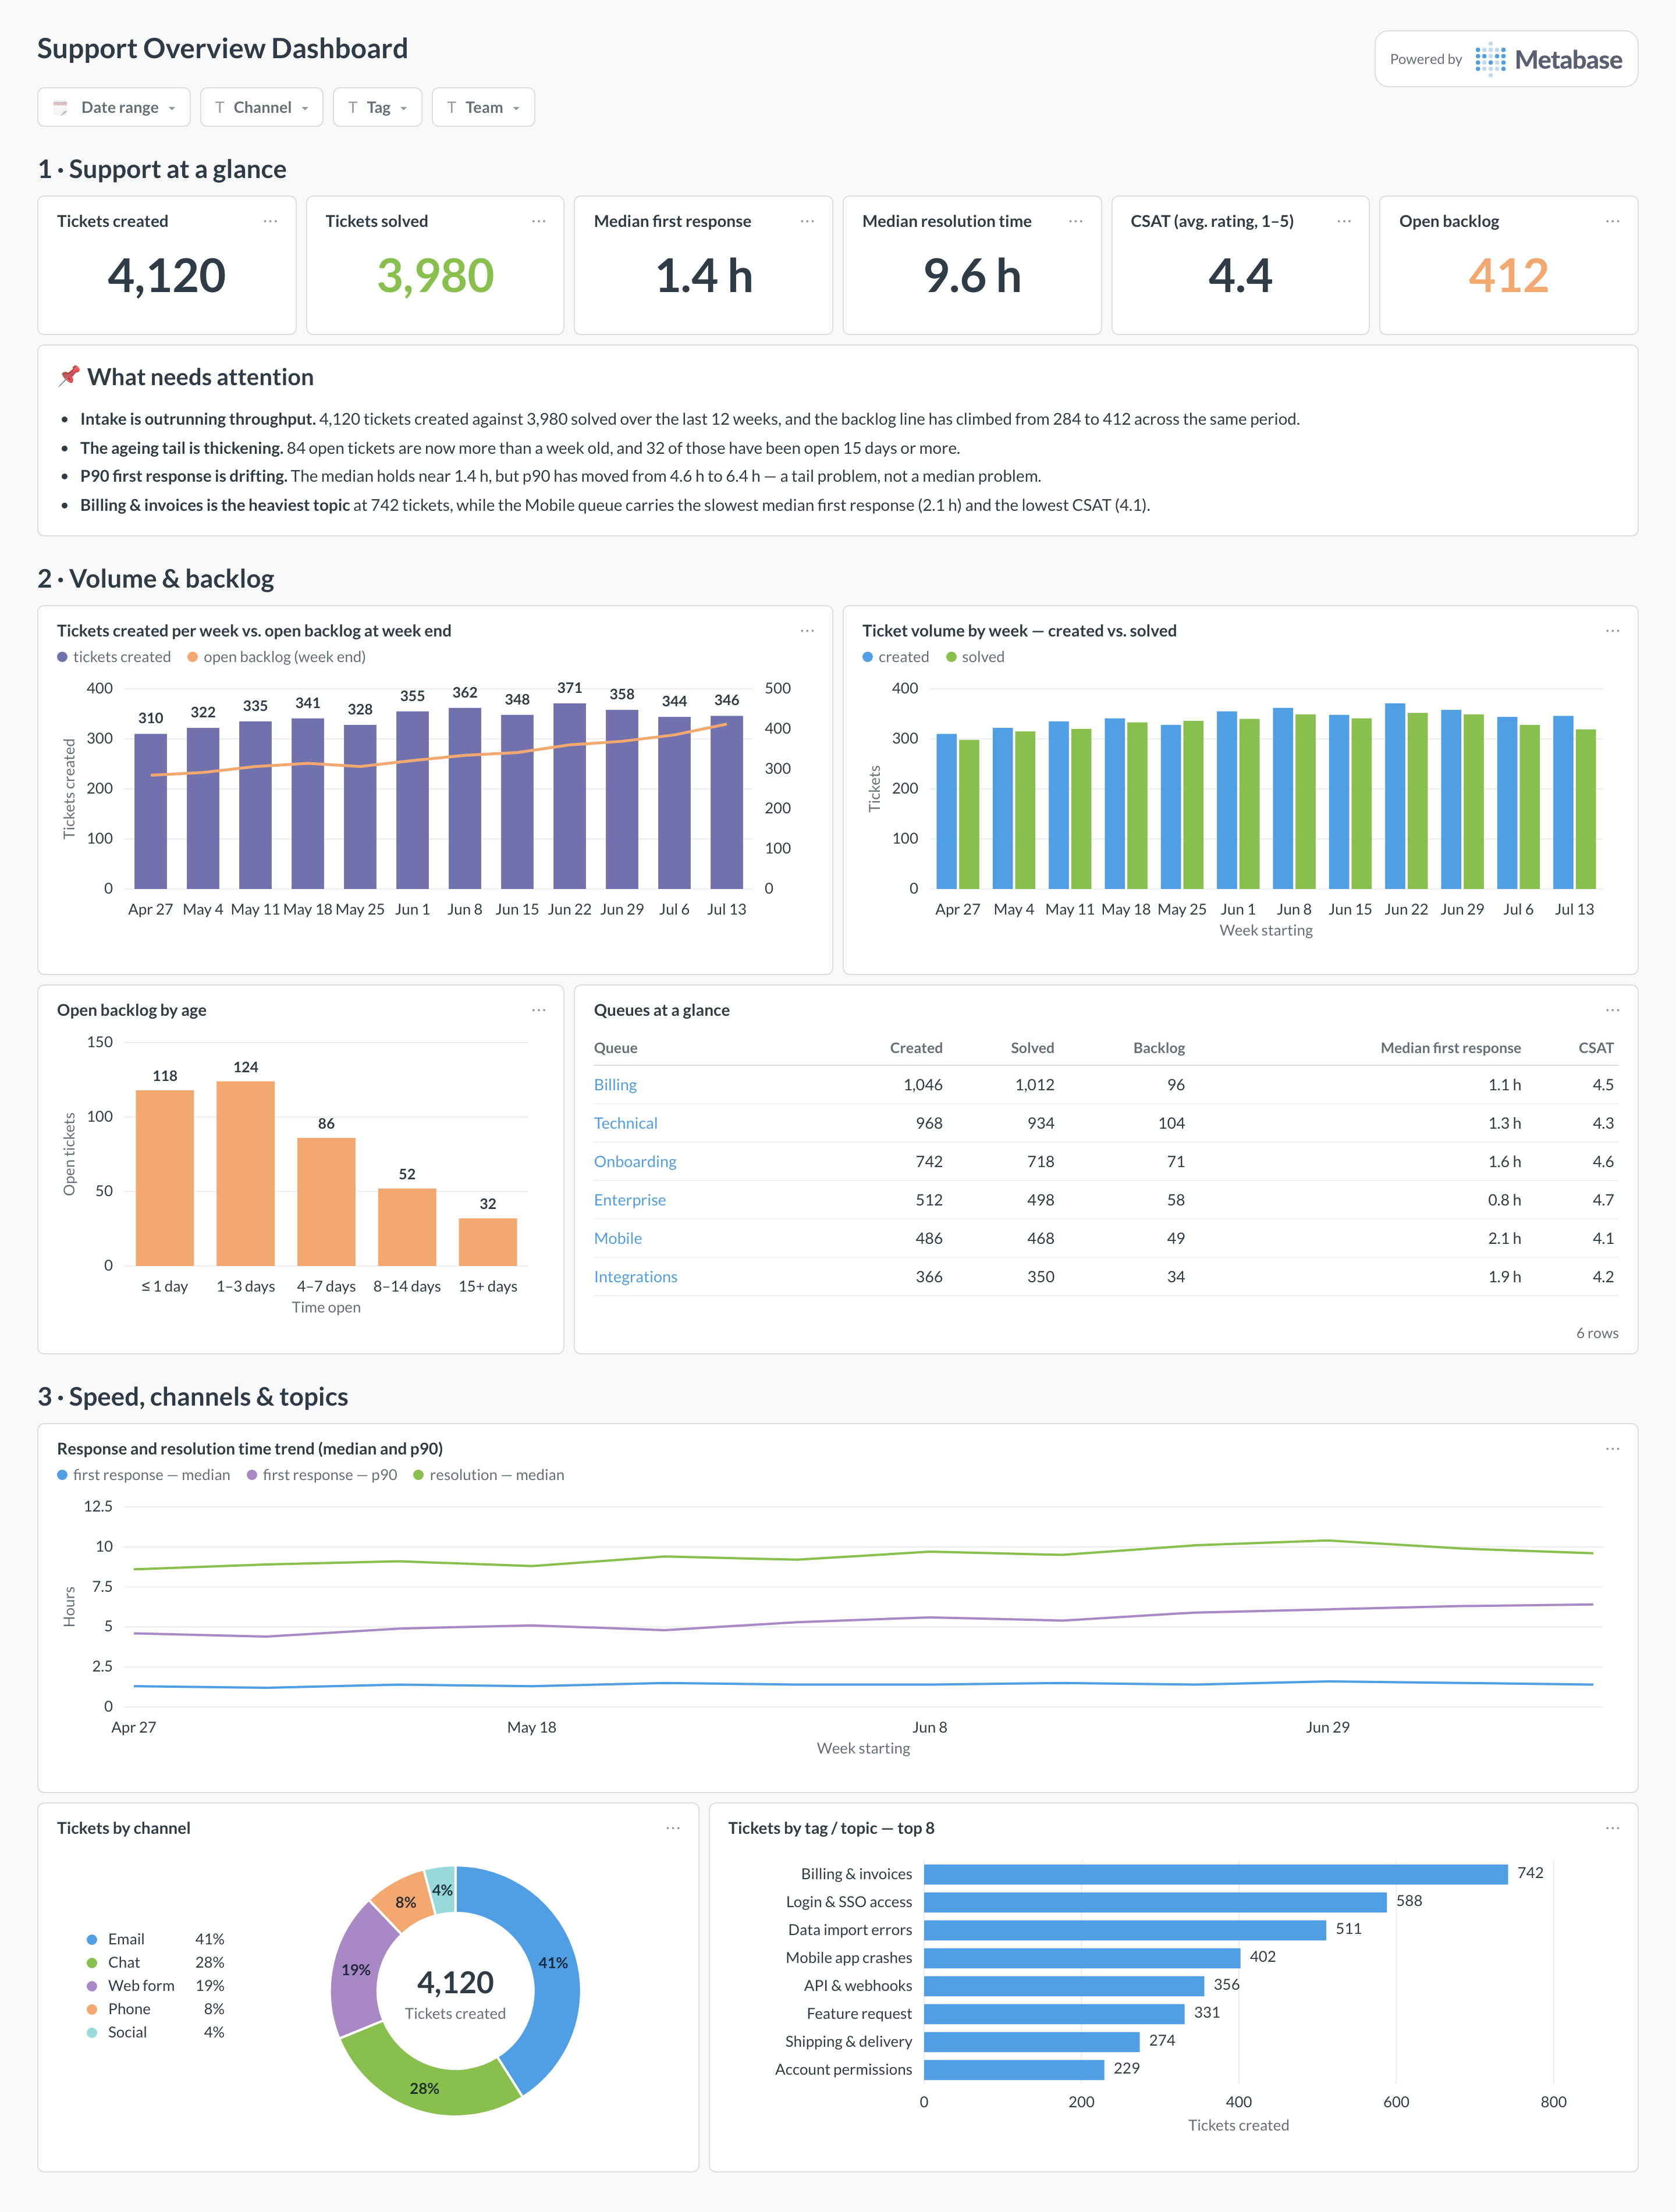
An example support overview dashboard in Metabase, built from Zendesk, Intercom, Front, or Freshdesk data. Figures are illustrative.
Which cards belong on a support overview dashboard?
Headline KPIs (top row)
- Tickets created vs. solved (this period)
- Median first-response time
- Median resolution time
- CSAT
Trend & load
- Ticket volume by week (created vs. solved)
- Open backlog by age
- Response and resolution time trend (median and p90)
- Tickets by channel and by tag/topic
What data does a support overview dashboard need?
- A modeled
ticketstable withcreated_at,first_response_at,resolved_at, channel, and tags. - A
ratingstable for CSAT. - For resolution and SLA accuracy, a status history table; without it, caveat those cards.
How do you build a support overview dashboard?
- Sync your help desk into a database (Zendesk, Intercom, Front, or Freshdesk).
- Model a thin clean layer with one definition of “resolved.”
- Build cards using medians (and p90), never averages, for time metrics.
- Add filters for channel, tag, team, and date range.
Example card SQL
-- Weekly support overview: volume, median first-response and resolution.
SELECT
date_trunc('week', t.created_at)                        AS week,
COUNT(*)                                                AS created,
COUNT(*) FILTER (WHERE t.resolved_at IS NOT NULL)       AS solved,
ROUND(PERCENTILE_CONT(0.5) WITHIN GROUP (
  ORDER BY EXTRACT(EPOCH FROM (t.first_response_at - t.created_at)) / 3600.0
)::numeric, 1)                                          AS median_frt_hours,
ROUND(PERCENTILE_CONT(0.5) WITHIN GROUP (
  ORDER BY EXTRACT(EPOCH FROM (t.resolved_at - t.created_at)) / 3600.0
)::numeric, 1)                                          AS median_resolution_hours
FROM tickets t
GROUP BY date_trunc('week', t.created_at)
ORDER BY week;