





What goes in an agent performance dashboard in Metabase?
An agent performance dashboard shows how work is distributed across the team and where to coach — solved volume, resolution time, and satisfaction by agent. Read it as a tool for balancing load and supporting people, not a leaderboard. Build it from support data synced into a database — see Zendesk, Gorgias, or Kustomer for the connection.
For: Team leads and managers. Refresh: daily.
Source: modeled tickets with assignee, resolved_at, and ratings. Framing: balance and coaching, not surveillance.
What does an agent performance dashboard look like?
Here’s the layout this guide builds. Team-level KPIs sit at the top, then the same four measures — solved volume, resolution time, satisfaction, and reopen rate — repeated per agent so load and quality are read side by side, and finally the backlog each person is carrying. Read it to rebalance queues and pick coaching topics, not to rank people.
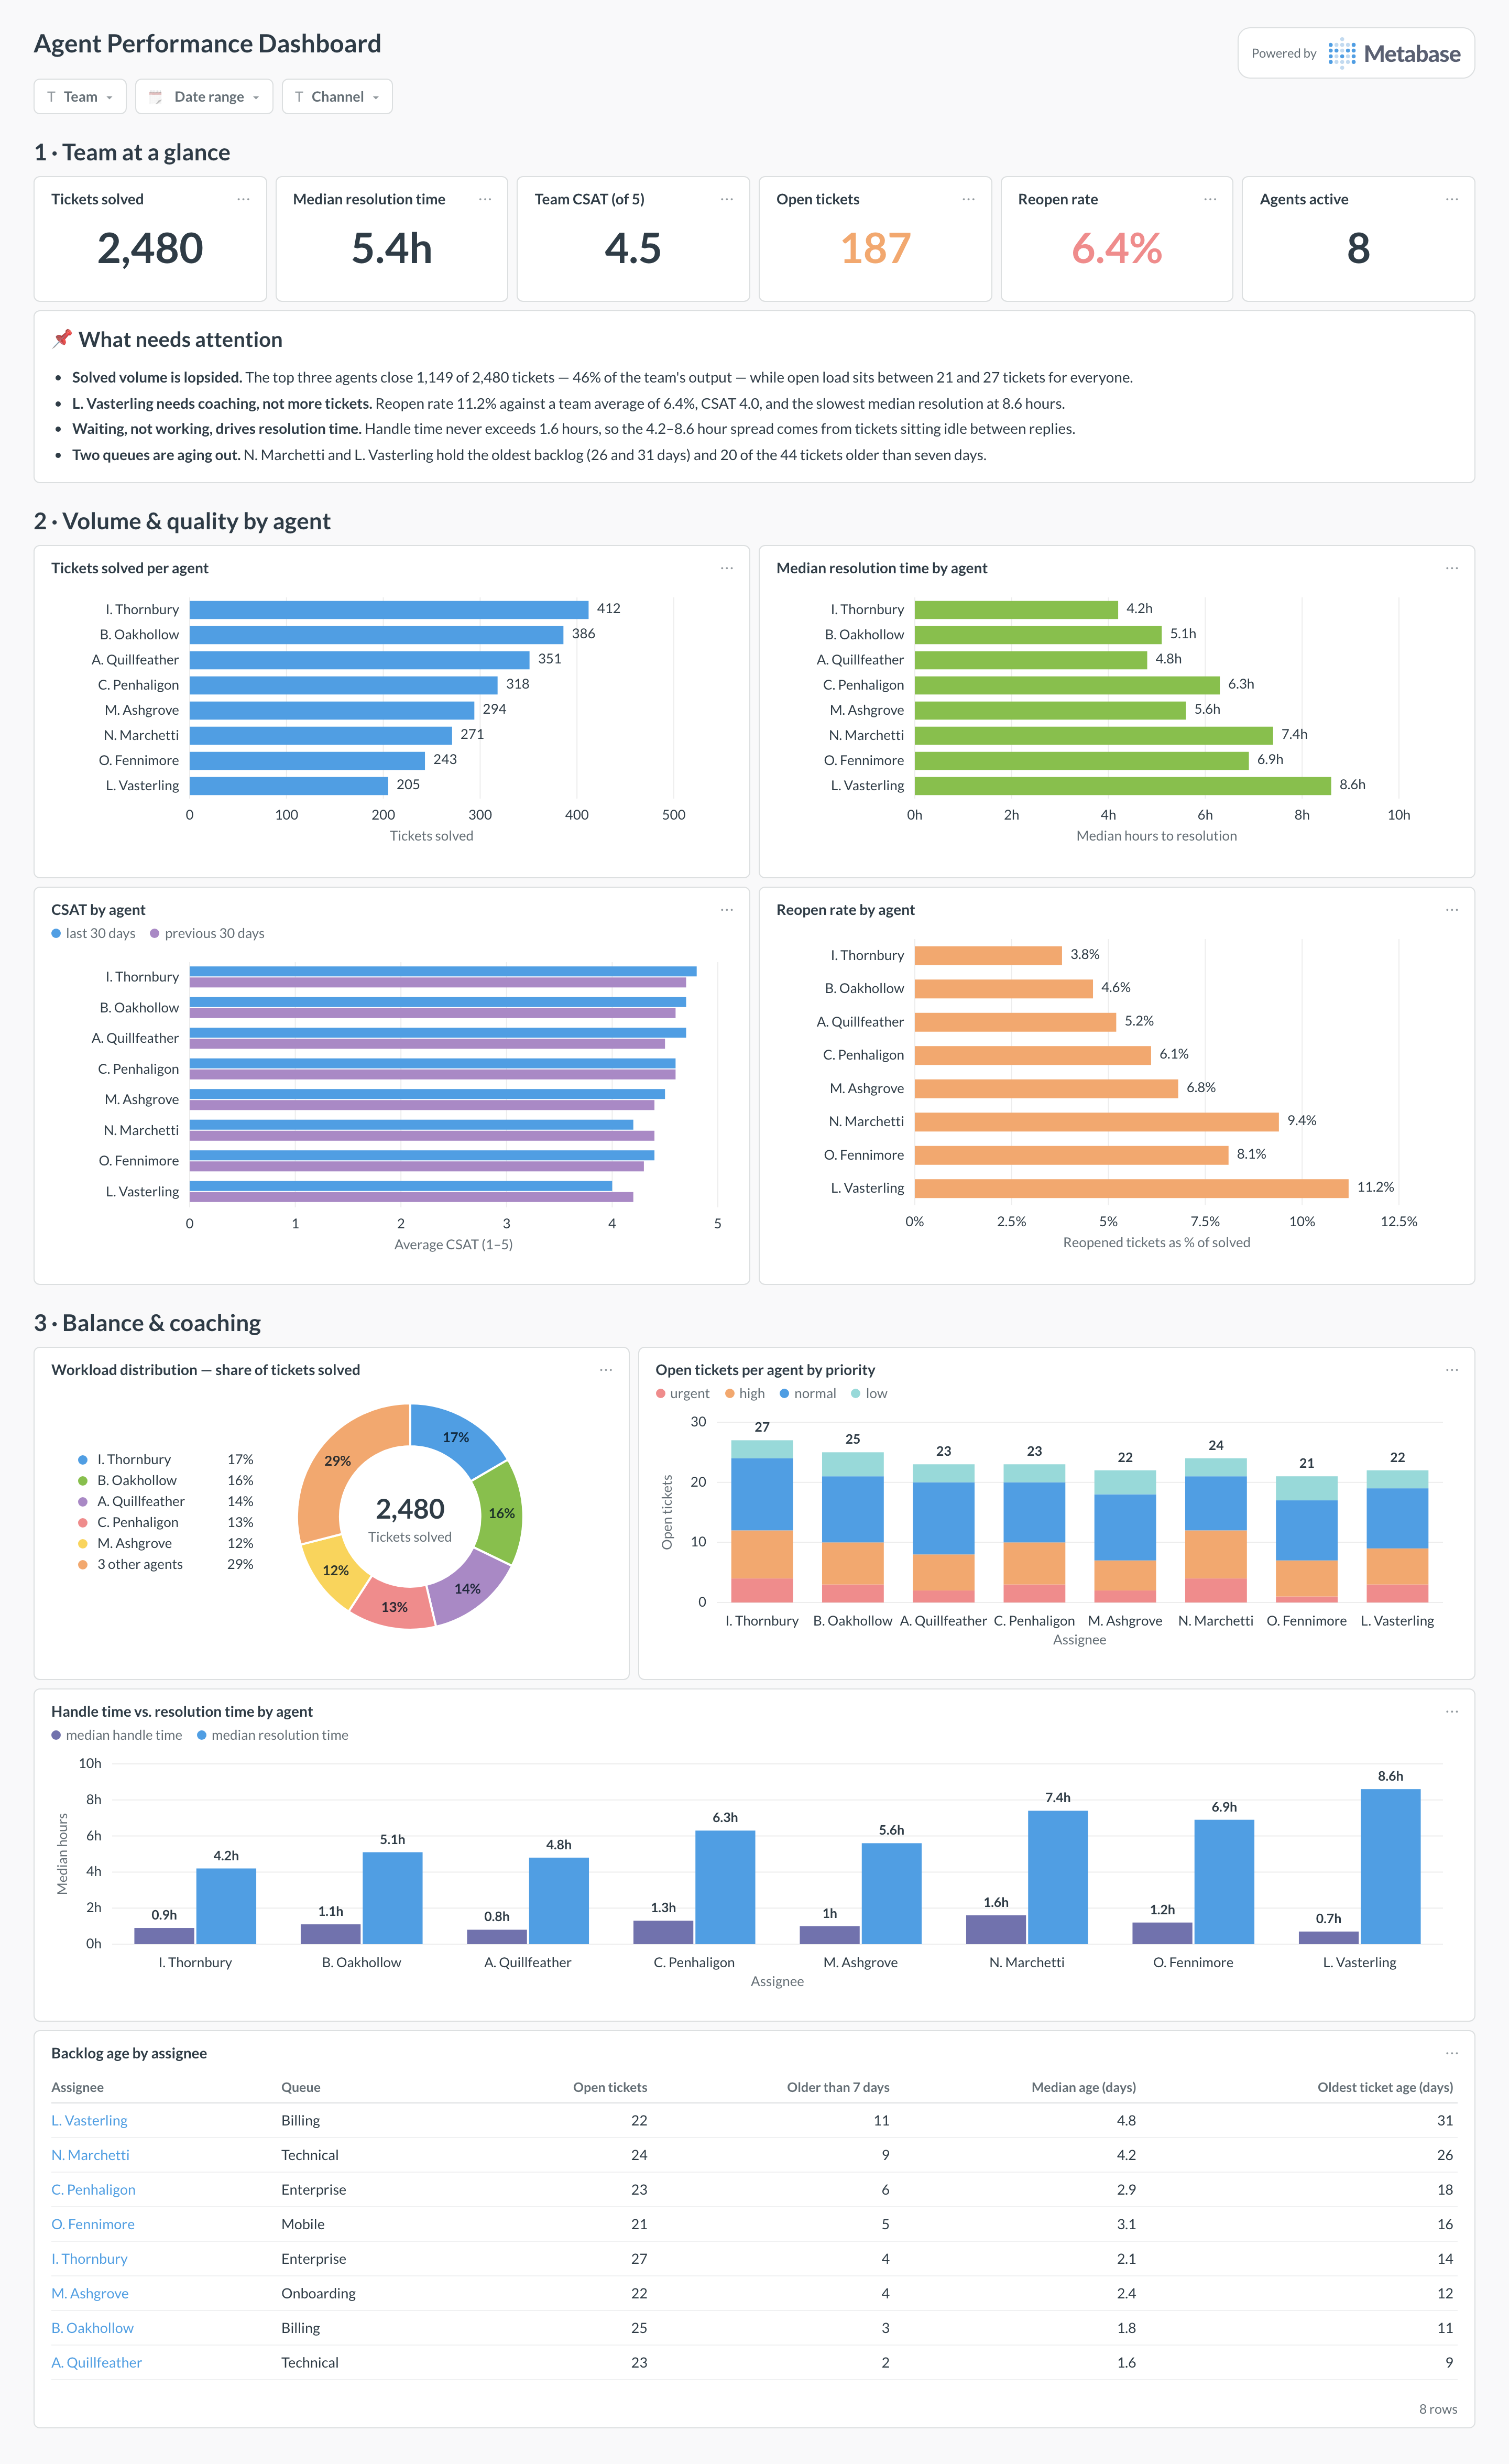
An example agent performance dashboard in Metabase, built from Zendesk, Gorgias, or Kustomer data. Figures are illustrative.
Which cards belong on an agent performance dashboard?
Team KPIs
- Tickets solved per agent
- Median resolution time by agent
- CSAT by agent
- Open tickets per agent (current load)
Balance & coaching
- Workload distribution across the team
- Reopen rate by agent
- Handle time vs. resolution time
- Backlog age by assignee (table)
What data does an agent performance dashboard need?
- A
ticketstable with an assignee and resolution timestamps. - An
agents/users table for names and teams. - Ratings joined to tickets for per-agent CSAT.
- Status history for reopen rate and handle time (optional).
How do you build an agent performance dashboard?
- Sync your help desk into a database (Zendesk, Gorgias, or Kustomer).
- Aggregate volume, resolution time, and CSAT per assignee.
- Show workload distribution so managers can rebalance, and pair volume with quality so speed isn’t rewarded alone.
- Add filters for team, date range, and channel.
Example card SQL
-- Team workload and median resolution time by agent, last 30 days.
SELECT
a.name                                                  AS agent,
COUNT(*)                                                AS solved,
ROUND(PERCENTILE_CONT(0.5) WITHIN GROUP (
  ORDER BY EXTRACT(EPOCH FROM (t.resolved_at - t.created_at)) / 3600.0
)::numeric, 1)                                          AS median_resolution_hours
FROM tickets t
JOIN agents a ON a.id = t.assignee_id
WHERE t.resolved_at >= CURRENT_DATE - INTERVAL '30 days'
GROUP BY a.name
ORDER BY solved DESC;