





What is CSAT, and how do you measure it in Metabase?
CSAT (customer satisfaction) is the share of rated interactions that customers scored positively. It's the quality counterweight to speed metrics like first-response time and resolution time — fast support that leaves people unhappy still fails. Measure it in Metabase from help desk data synced into a database (Zendesk, Intercom, Front, or Freshdesk).
What does a CSAT chart look like in Metabase?
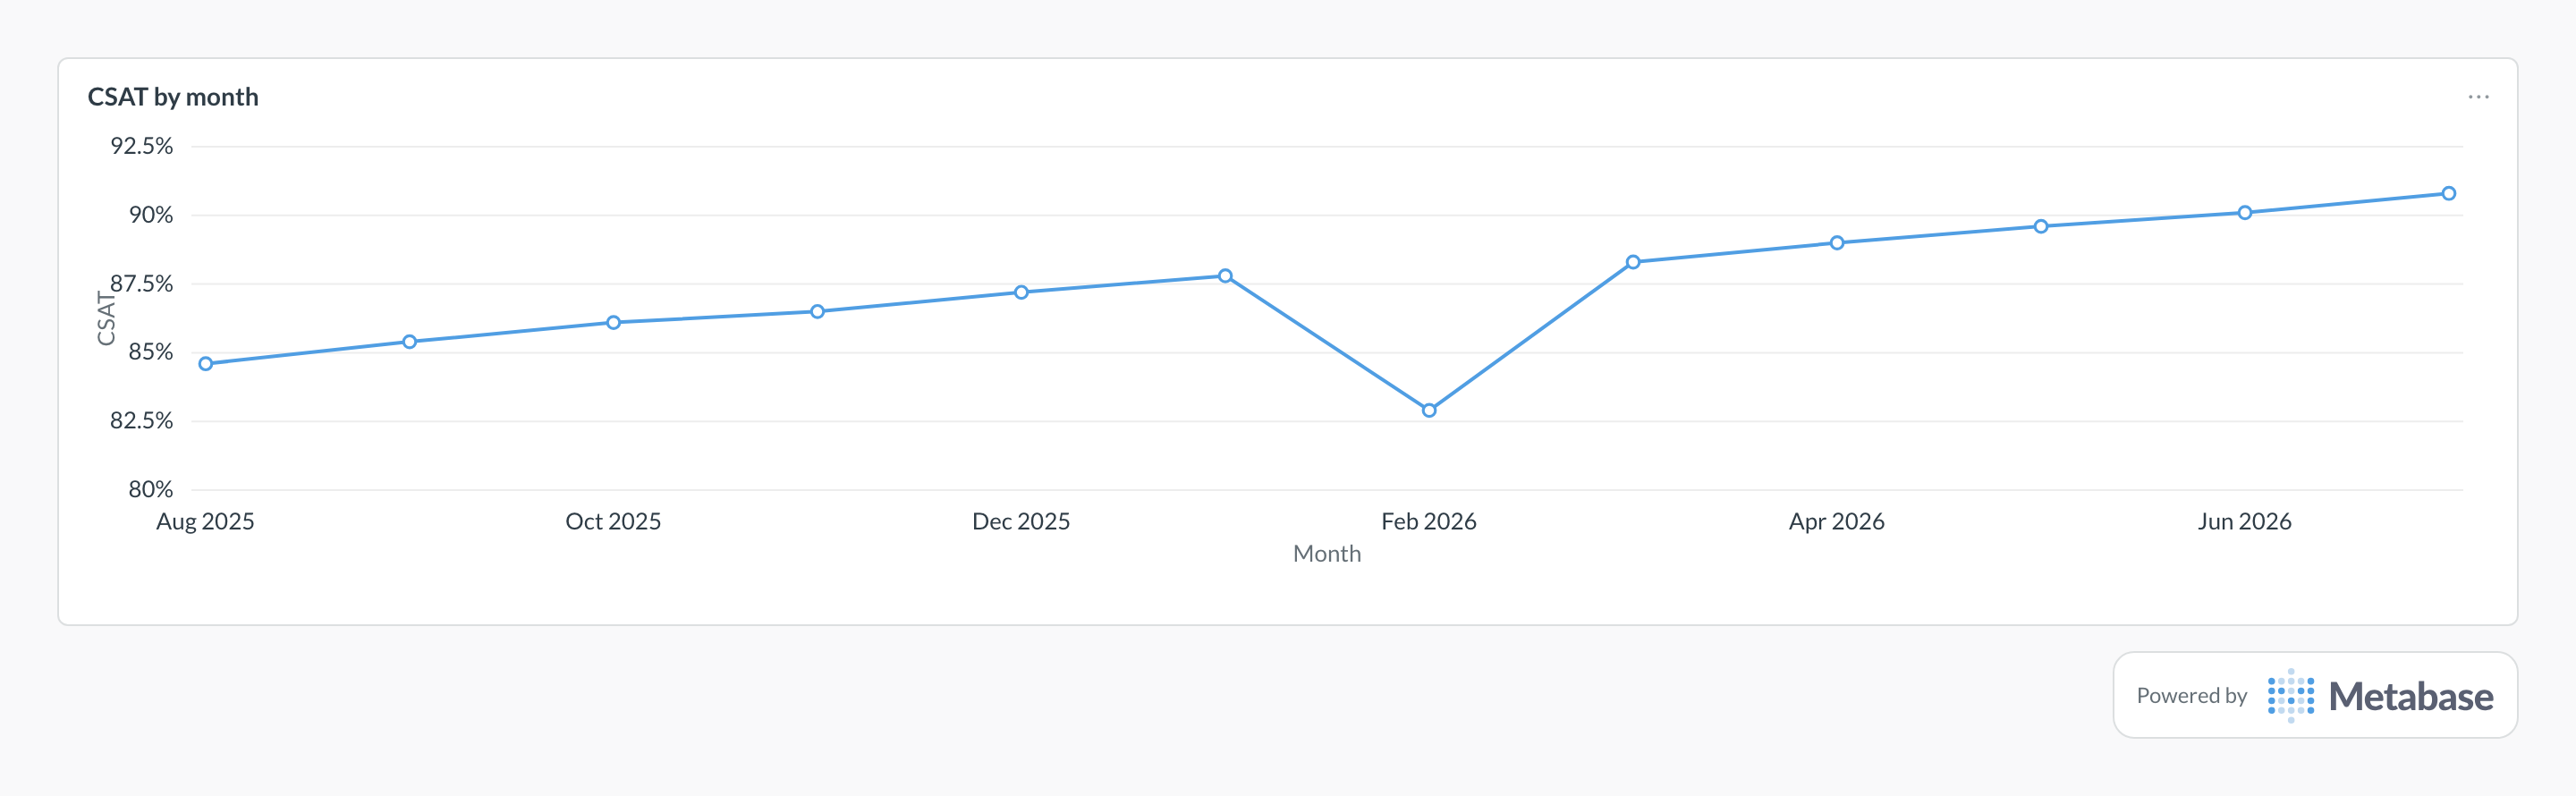
Plot the share of positive ratings per month as a line — the slow climb, a point or two per quarter, is what durable quality work looks like. A one-month drop like February's usually follows a rough release or a support backlog spike; check the response rate and rating volume before reading too much into it.
How is CSAT calculated?
Pick what counts as "positive" for your scale (for a 5-point scale, usually 4 and 5), then:
- CSAT = positive ratings ÷ total ratings received, as a percentage.
- Response rate = ratings received ÷ ratable (usually solved) tickets. Report it alongside CSAT, always.
Segment CSAT by channel, tag/topic, and team to find where dissatisfaction concentrates — an org-wide average hides the areas worth fixing.
What data does CSAT need?
- A ratings/survey table with a score and a link to the ticket or conversation.
- The ticket table, to compute the response rate against solved tickets.
- A consistent mapping of raw scores to positive/negative, especially if you run multiple survey types.
SQL patterns
Positive ratings over all ratings, monthly.
-- CSAT and response rate by month.
-- A rating is "positive" when it's good/great (e.g. 4-5 on a 5-point scale).
SELECT
  date_trunc('month', r.created_at)                       AS month,
  COUNT(*)                                                AS ratings,
  COUNT(*) FILTER (WHERE r.score >= 4)                    AS positive,
  ROUND(100.0 * COUNT(*) FILTER (WHERE r.score >= 4)
        / NULLIF(COUNT(*), 0), 1)                         AS csat_pct
FROM ticket_ratings r
GROUP BY date_trunc('month', r.created_at)
ORDER BY month;Rated tickets over solved tickets — the context CSAT needs.
-- CSAT response rate: rated tickets ÷ ratable (solved) tickets.
SELECT
  date_trunc('month', t.resolved_at)                      AS month,
  COUNT(*)                                                AS solved,
  COUNT(r.ticket_id)                                      AS rated,
  ROUND(100.0 * COUNT(r.ticket_id)
        / NULLIF(COUNT(*), 0), 1)                         AS response_rate_pct
FROM tickets t
LEFT JOIN ticket_ratings r ON r.ticket_id = t.id
WHERE t.resolved_at IS NOT NULL
GROUP BY date_trunc('month', t.resolved_at)
ORDER BY month;
Pitfalls
Where this metric applies
- Zendesk + Metabase — satisfaction ratings on solved tickets
- Intercom + Metabase — conversation ratings and remarks
- Front + Metabase — CSAT survey responses
- Freshdesk + Metabase — customer satisfaction survey results