





What goes in a CSAT dashboard in Metabase?
A CSAT dashboard tracks the quality of support — how satisfied customers are, how many actually respond, and what's driving the unhappy ones. It's the counterweight to the speed metrics on your SLA dashboard. Build it from support data synced into a database — see Zendesk or Intercom for the connection.
For: Support leaders, QA, CX. Refresh: daily.
Source: modeled ratings/surveys joined to tickets, with tags and teams.
What does a CSAT dashboard look like?
Here’s the layout this guide builds. The headline score and response rate sit together at the top so a small sample can’t flatter the number, then the trend and the full 1–5 rating mix, then the tags, teams, and channels driving dissatisfaction — ending in the raw negative comments. Read it monthly for the trend and weekly for the comments.
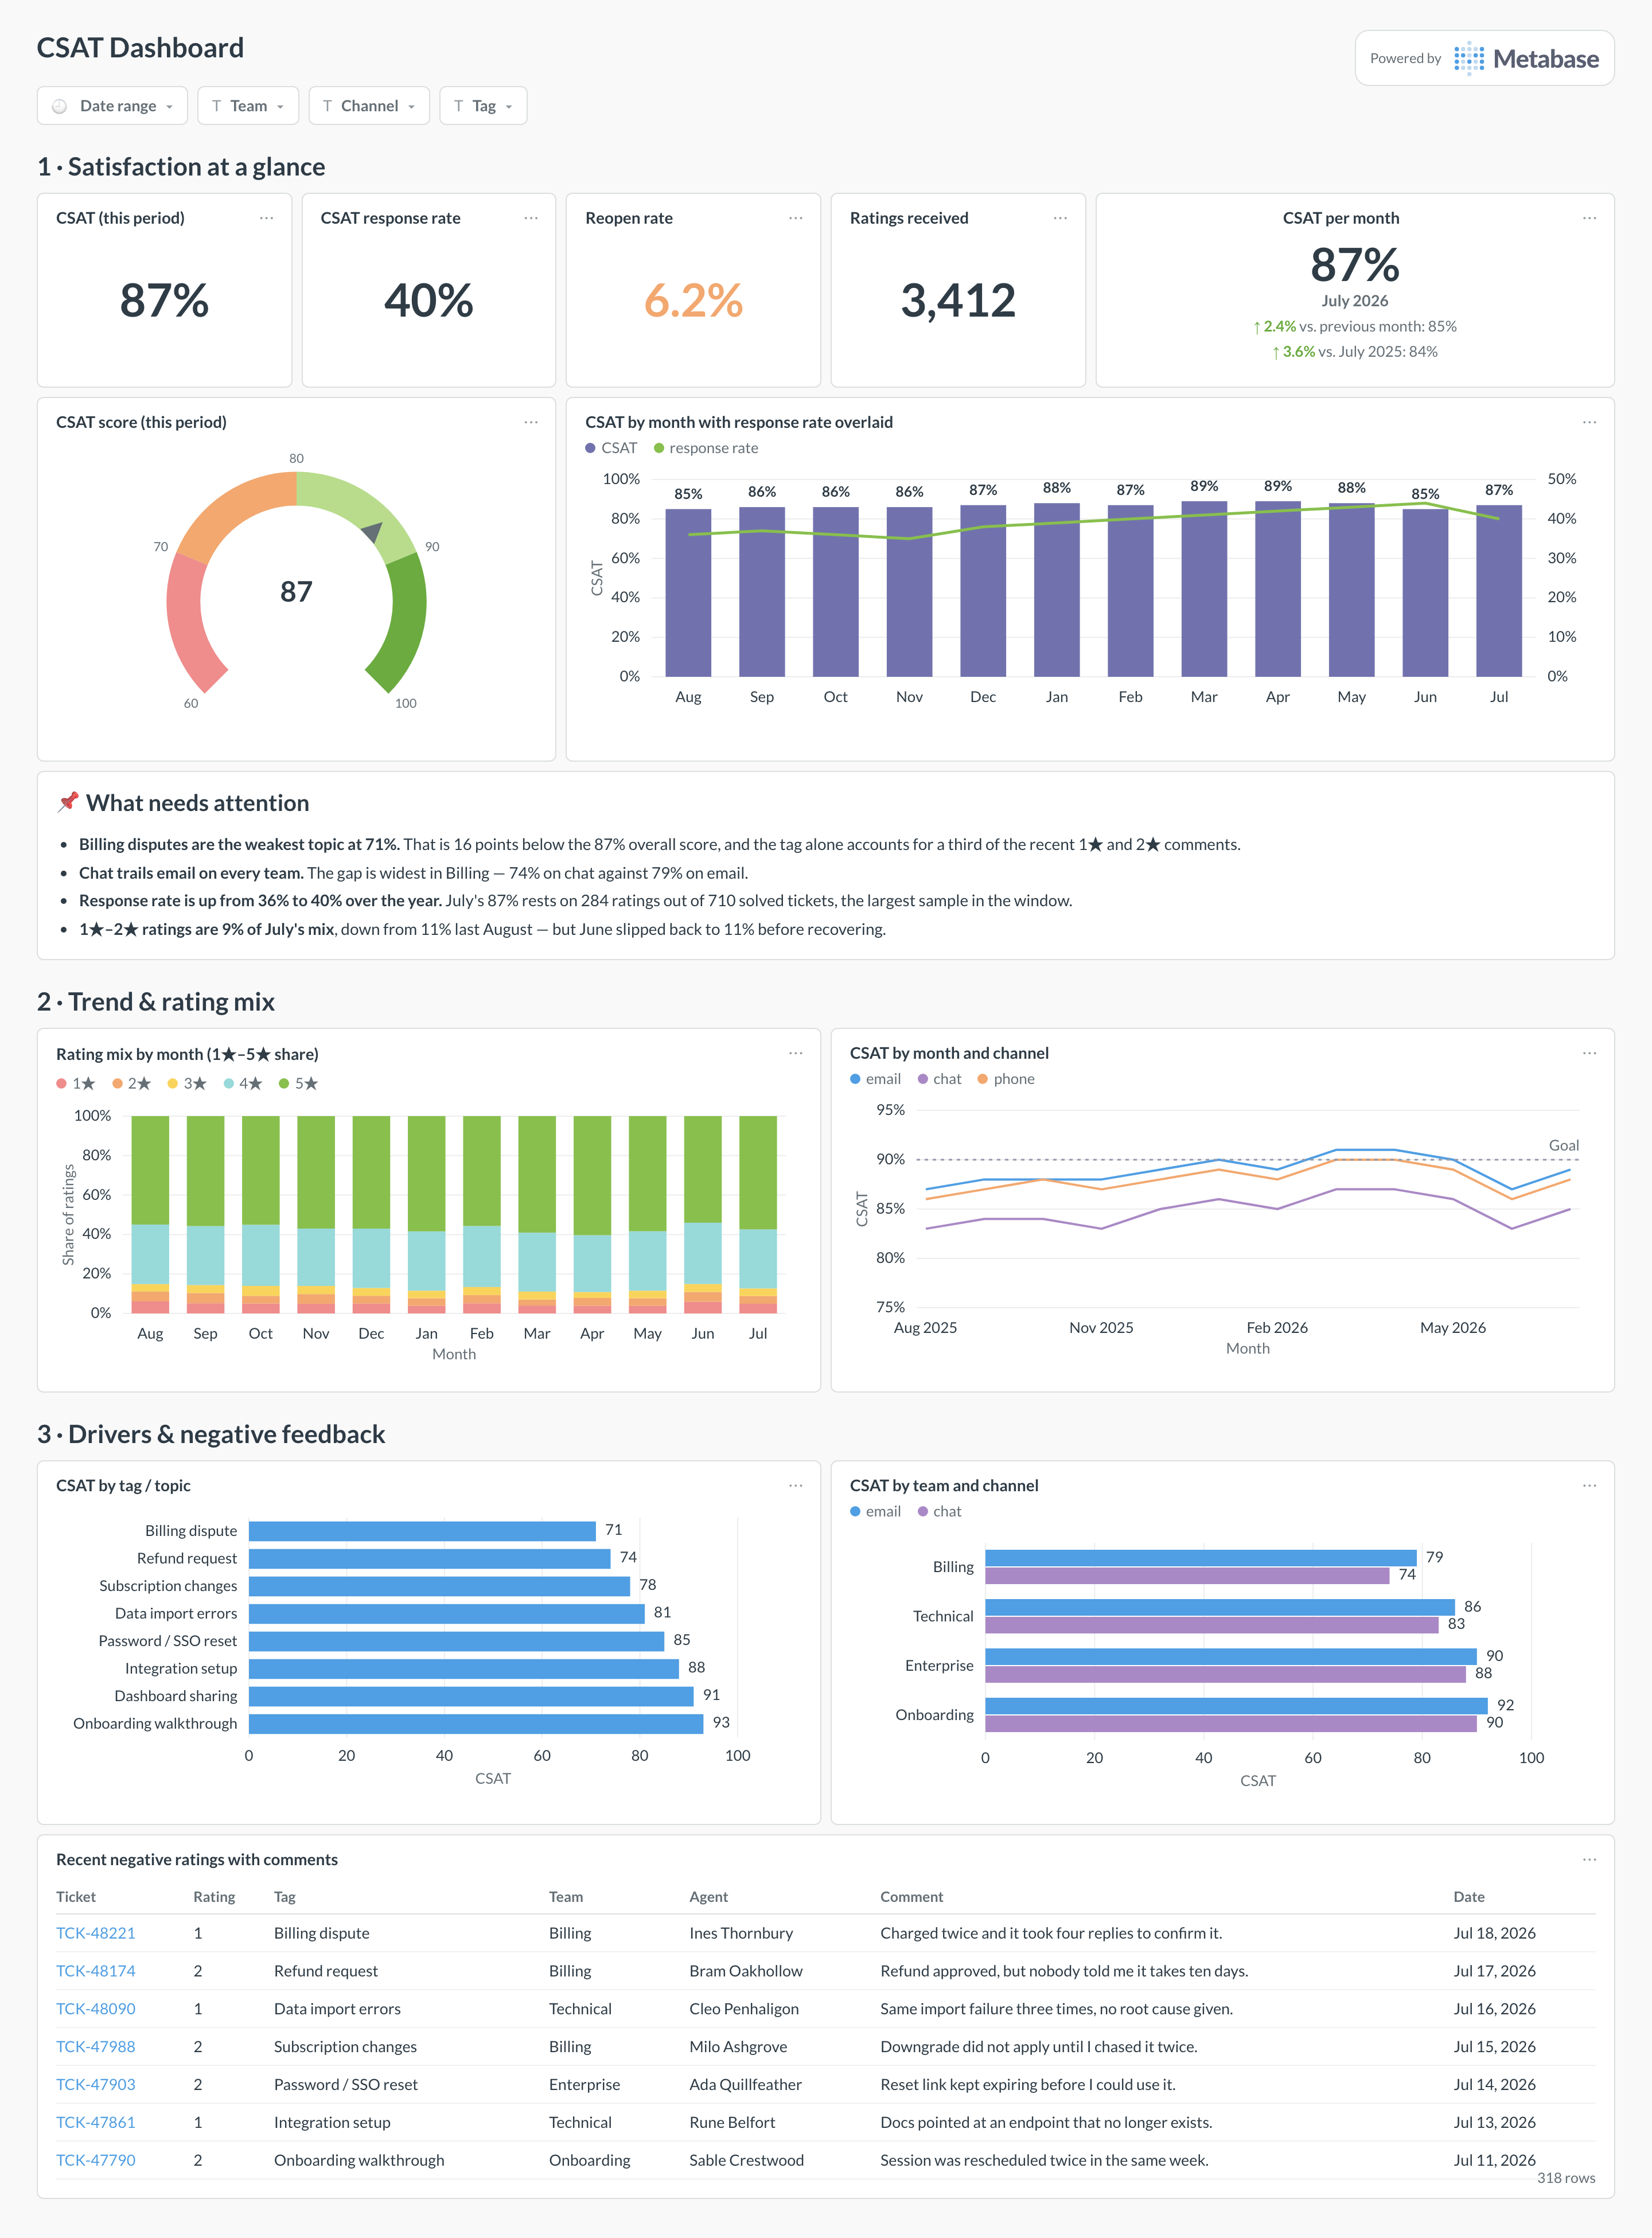
An example CSAT dashboard in Metabase, built from Zendesk or Intercom data. Figures are illustrative.
Which cards belong on a CSAT dashboard?
Headline KPIs
- CSAT (this period)
- CSAT response rate
- Reopen rate
- Ratings received
Trend & drivers
- CSAT by month with response rate overlaid
- CSAT by tag / topic (drivers)
- CSAT by team and channel
- Recent negative ratings with comments (table)
What data does a CSAT dashboard need?
- A
ratings/survey table with a score linked to the ticket. - The
ticketstable for response rate against solved tickets. - Tags, team, and channel for driver breakdowns.
- Status history if you want reopen rate too.
How do you build a CSAT dashboard?
- Sync your help desk into a database (Zendesk or Intercom).
- Fix the positive-rating threshold once and keep it constant.
- Always show response rate next to CSAT so a small sample can’t mislead.
- Break CSAT down by tag and team to find where to improve.
Example card SQL
-- CSAT and response rate by tag/topic over the last 90 days.
SELECT
t.tag,
COUNT(r.id)                                             AS ratings,
ROUND(100.0 * COUNT(r.id) FILTER (WHERE r.score >= 4)
      / NULLIF(COUNT(r.id), 0), 1)                      AS csat_pct,
ROUND(100.0 * COUNT(r.id)
      / NULLIF(COUNT(DISTINCT t.id), 0), 1)             AS response_rate_pct
FROM tickets t
LEFT JOIN ticket_ratings r ON r.ticket_id = t.id
WHERE t.resolved_at >= CURRENT_DATE - INTERVAL '90 days'
GROUP BY t.tag
ORDER BY ratings DESC;