





What is SLA breach rate, and how do you measure it in Metabase?
SLA breach rate is the share of tickets that missed a service-level target — first response or resolution — divided by tickets that carried an SLA. It's the metric that turns response-time promises into a pass/fail score. Track it in Metabase from help desk SLA events synced into a database (Zendesk, Freshdesk, Intercom, or Jira Service Management).
breached ÷ tickets with an SLA per policy
per month, on the clock the SLA was promised in (usually business hours, paused
while pending on the customer). Report it broken down by policy and priority —
the overall rate hides exactly the segments that matter.
What does an SLA breach rate chart look like in Metabase?
Chart breached SLA targets as a share of tickets carrying an SLA per month, per policy. The steady decline is staffing and routing work showing up in the number your contracts actually care about, while a spike like February's almost always means volume outran staffing for a stretch — read it against ticket volume before touching the targets.
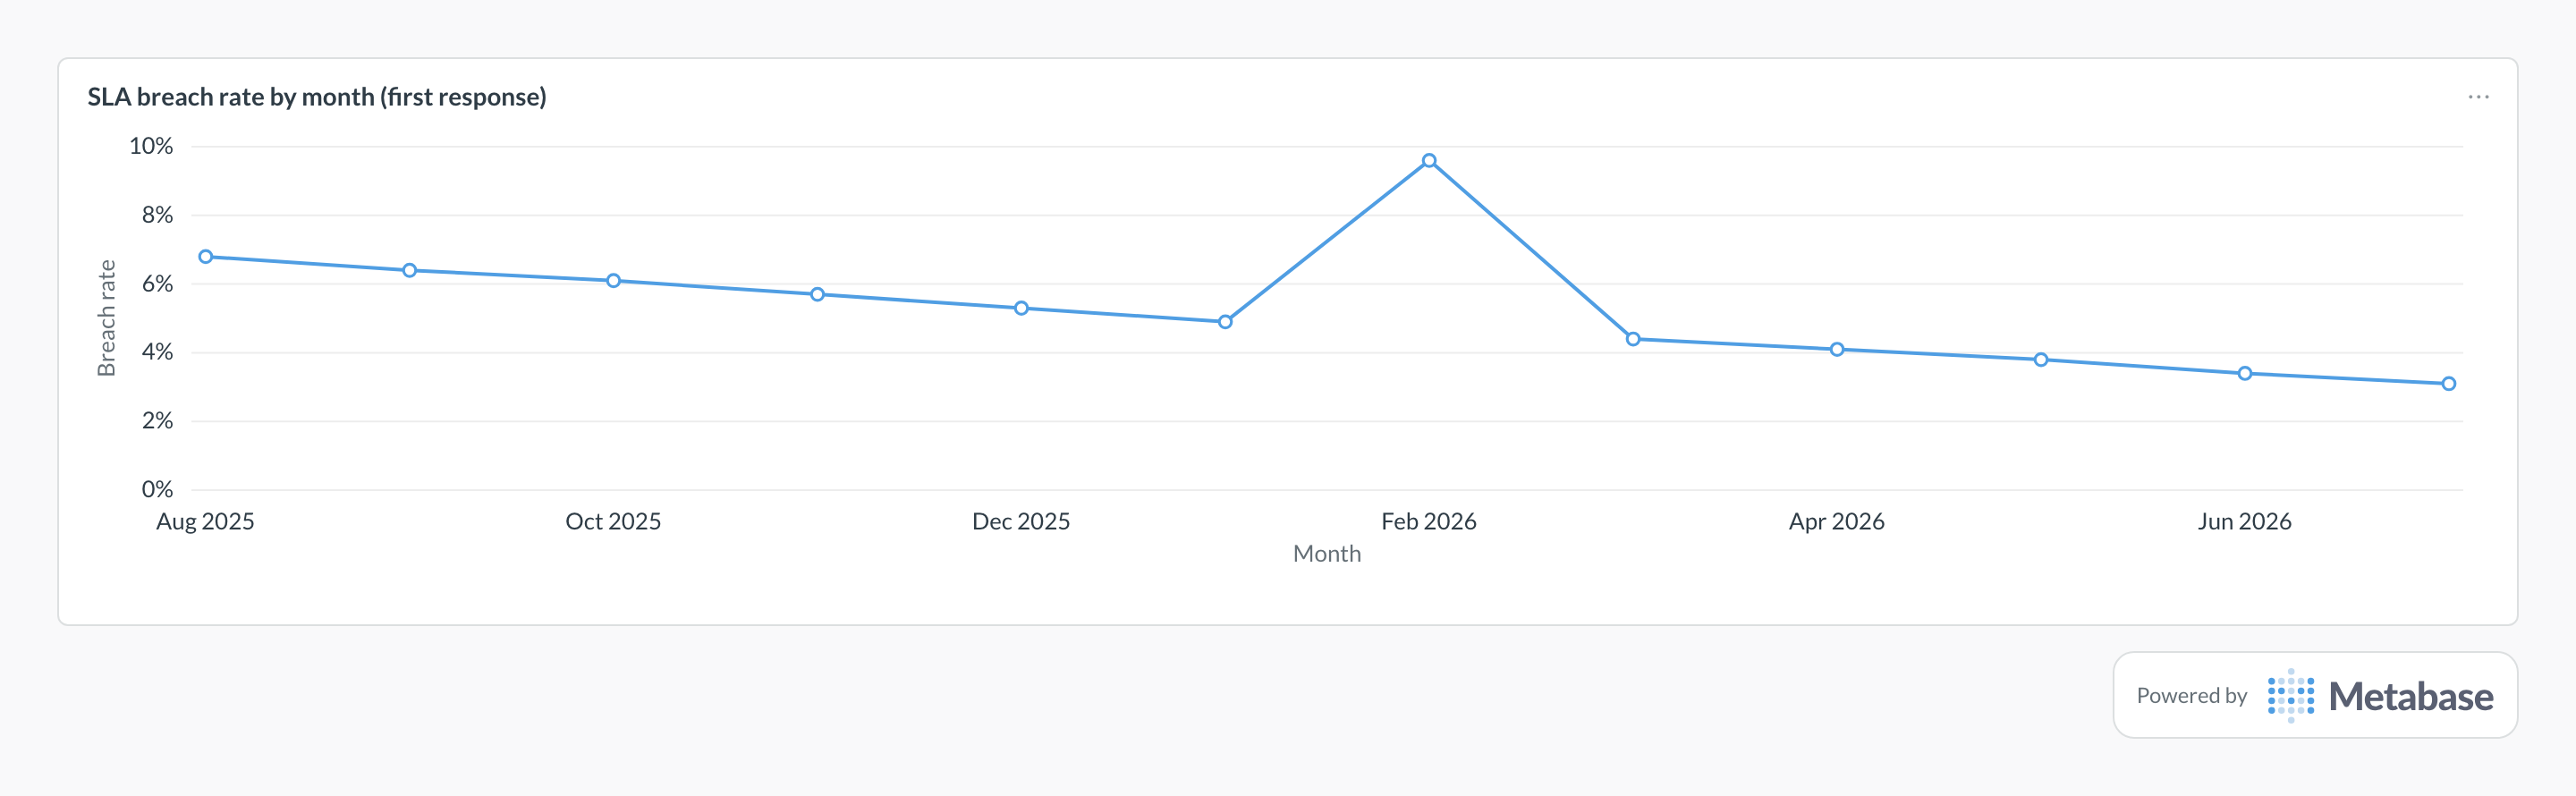
What SLA breach rate measures
It measures kept promises. Unlike first-response time or resolution time, which describe the distribution of waits, breach rate scores each ticket against the specific target it was promised — 1 hour for urgent chat, 8 business hours for normal email — and reports the failure share. That makes it the right number for contracts, QBRs, and staffing decisions.
The distinction matters because averages hide tails. A team can post a perfectly acceptable mean response time while a stubborn slice of tickets blows through targets by days — and that slice is where escalations, churn, and credits come from. Breach rate puts the tail on the chart.
Always segment by policy and priority. Each SLA policy is a different promise to a different audience, and rolling them into one number lets a flood of easy low-priority passes bury the urgent-tier failures. A per-policy view alongside ticket volume also shows whether breaches track workload or process.
What data does it need?
-
An SLA events table with one row per ticket per target:
policy_name,metric(first response or resolution),target_minutes, and outcome (achieved,breached, or stillrunning). - Elapsed time on the SLA clock — business-hours minutes with pending-customer pauses already excluded, as help desks compute it. Deriving this from raw timestamps means rebuilding schedules and holiday calendars; avoid it if the source provides the number.
-
priorityand ticket attributes (channel, plan tier) for breakdowns. - For early warning: elapsed time on open tickets, refreshed frequently enough to act on.
SQL patterns
Completed SLA cycles only — the share that ended in a breach, per promise.
-- Monthly breach rate by SLA policy and priority.
-- One row per ticket per SLA target in sla_events; breached is set
-- when the (business-hours) clock ran past the target.
SELECT
  date_trunc('month', s.applied_at) AS month,
  s.policy_name,
  s.priority,
  COUNT(*) AS tickets_with_sla,
  ROUND(
    100.0 * COUNT(*) FILTER (WHERE s.breached)
    / NULLIF(COUNT(*), 0), 1
  ) AS breach_rate_pct
FROM sla_events s
WHERE s.metric = 'first_response'
  AND s.status IN ('achieved', 'breached')
GROUP BY 1, 2, 3
ORDER BY 1, 2, 3;Open tickets that have used 80% or more of their SLA budget — the queue to work next.
-- Early warning: open tickets that have burned 80%+ of their
-- SLA budget but haven't breached yet. Paused (pending-customer)
-- time is already excluded from elapsed_business_minutes.
SELECT
  s.ticket_id,
  s.policy_name,
  s.priority,
  s.metric,
  s.target_minutes,
  s.elapsed_business_minutes,
  ROUND(
    100.0 * s.elapsed_business_minutes
    / NULLIF(s.target_minutes, 0), 0
  ) AS budget_used_pct
FROM sla_events s
WHERE s.status = 'running'
  AND s.elapsed_business_minutes >= 0.8 * s.target_minutes
ORDER BY budget_used_pct DESC;
Pitfalls
Where this metric applies
- Zendesk + Metabase — ticket metric events carry per-target business-hours elapsed time and breach flags
- Freshdesk + Metabase — SLA policies per group and priority, with pending states pausing the clock
- Intercom + Metabase — conversation SLA states for first reply and next reply targets
- Jira + Metabase — Jira Service Management SLA cycles with goal, elapsed, and breached fields