





What is first contact resolution rate, and how do you measure it in Metabase?
First contact resolution rate (FCR) is the share of resolved tickets that were solved in a single interaction — one agent touch, no transfers, no reopens — divided by all resolved tickets. It measures how often customers get an answer without a back-and-forth. Track it in Metabase from help desk data synced into a database (Zendesk, Intercom, Freshdesk, or Front).
one-touch resolved ÷ resolved per month.
Decide upfront whether "first contact" means strictly one touch or merely no reopen
within N days, and never read FCR alone: paired with CSAT it measures quality; alone, it rewards closing tickets prematurely.
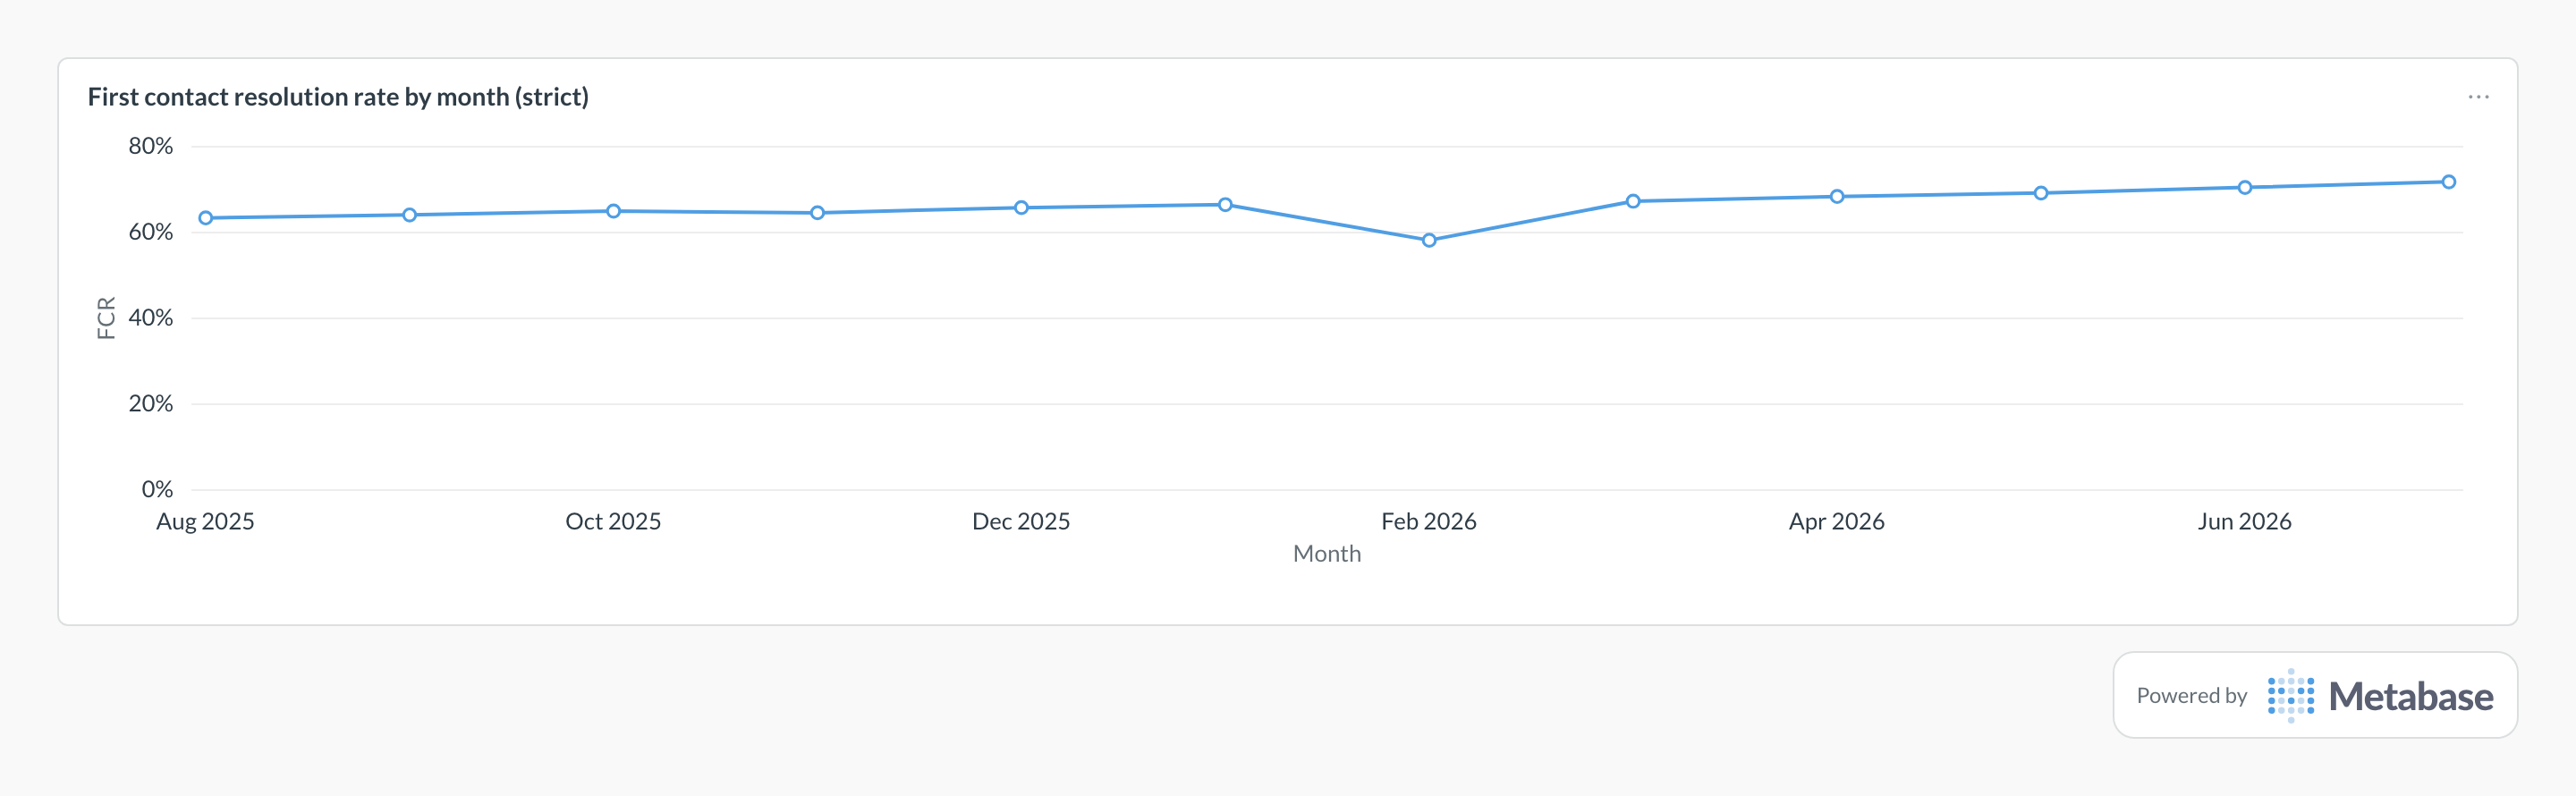
What does a first contact resolution rate chart look like in Metabase?
Plot strict FCR per resolution month as a line and read the slope: the climb from around 63% to 72% is macros, docs, and routing getting sharper. A one-month drop like February's usually follows a big release — novel tickets take several touches until the fixes are documented — so check what shipped before reading it as a team problem.
What first contact resolution rate measures
It measures effort — the customer's, not yours. Every extra touch on a ticket is another wait, another context reload, another chance to churn. A high FCR means answers land complete the first time; a low one means customers are relaying between agents or re-explaining their problem after a transfer.
The definition has two common variants, and they are not interchangeable. Strict (one-touch) FCR counts a ticket only if a single agent resolved it in one reply, with no transfers and no reopen at any point. Lenient (no-reopen) FCR counts any ticket that stayed closed for N days — usually 7 or 14 — after resolution, however many replies it took. Strict FCR is the sharper operational lever; the no-reopen variant tracks closer to what customers would call "solved the first time." Either works, but the model must pick one and every chart must say which.
FCR is also the most gameable support metric. Closing tickets early inflates it instantly, so it belongs on the same dashboard as CSAT and resolution time — if FCR rises while those two sour, the gain is an artifact.
What data does it need?
-
A modeled tickets table with
resolved_atand a way to detect reopens — areopened_attimestamp or a status-change event log. -
Per-ticket touch counts:
agent_touch_count(public agent replies) andtransfer_count(group or assignee changes), usually derived from a messages or audit-events table. -
channelandtopic(or ticket category) for segmentation — FCR is only actionable once you can see which segments drag it down. - Optionally, requester identity, so a fresh ticket from the same customer on the same topic within a few days can be treated as a reopen.
SQL patterns
One agent touch, no transfers, never reopened — as a share of tickets resolved that month.
-- Strict FCR by month: one agent touch, no transfers, never reopened.
-- Assumes a modeled tickets table; count by resolution month.
SELECT
  date_trunc('month', t.resolved_at) AS month,
  COUNT(*) AS resolved_tickets,
  ROUND(
    100.0 * COUNT(*) FILTER (
      WHERE t.agent_touch_count = 1
        AND t.transfer_count = 0
        AND t.reopened_at IS NULL
    ) / NULLIF(COUNT(*), 0), 1
  ) AS fcr_pct
FROM tickets t
WHERE t.resolved_at IS NOT NULL
GROUP BY 1
ORDER BY 1;Last-quarter breakdown, worst segments first, with small segments filtered out.
-- FCR by channel and topic over the last quarter, worst first.
-- The HAVING clause hides segments too small to trust.
SELECT
  t.channel,
  t.topic,
  COUNT(*) AS resolved_tickets,
  ROUND(
    100.0 * COUNT(*) FILTER (
      WHERE t.agent_touch_count = 1
        AND t.transfer_count = 0
        AND t.reopened_at IS NULL
    ) / NULLIF(COUNT(*), 0), 1
  ) AS fcr_pct
FROM tickets t
WHERE t.resolved_at >= CURRENT_DATE - INTERVAL '90 days'
GROUP BY 1, 2
HAVING COUNT(*) >= 25
ORDER BY fcr_pct;
Pitfalls
Where this metric applies
- Zendesk + Metabase — ticket metrics include reply counts, reopens, and group transfers
- Intercom + Metabase — conversation parts give touch counts; teammate changes mark transfers
- Freshdesk + Metabase — ticket activities capture responses, reopens, and group changes
- Front + Metabase — conversation messages and reopen events per teammate
Related
Metrics
Dashboards and analytics
FAQ
What counts as 'first contact' resolved?
What's a good first contact resolution rate?
Can agents game FCR?
How is FCR different from resolution time?
How do you track FCR in Metabase?
agent_touch_count, transfer_count, and reopened_at, then chart the monthly rate and a by-channel breakdown, and pin both next to CSAT on a support overview dashboard.