

As a data engineer, I constantly want to develop data-driven applications that fuel Data Science and Business Intelligence. I want to build products and services that add value and provide a competitive advantage because data is becoming the source of intelligent decision-making.
I have learned that accurate and real-time data is a key driver.
I also have seen organizations that are missing data and do not have a true understanding of performance, industry, etc. They tend to make decisions based on inaccuracy or maybe what they feel is right.
Meanwhile, companies who leverage their data are developing a better understanding of their market, business, and competitor positions. This type of information builds confidence. It is a competitive advantage.
How do data pipelines work?
So how can an organization keep its data up-to-date and work towards this advantage?
Data pipelines… the building block for success in analytics.
Generally, a data-driven company will hire a data engineer/architect to implement the Extract-Transform-Load (ETL) tools that are data pipelines within their infrastructure.
But how exactly do they do this?
What are the steps to building a data pipeline?
Data pipelines will consist of a few steps including extraction from a source, data preprocessing, validation, and a destination for the data. Let’s look at a simple example.
In this use case, I am scraping data from a vinyl record marketplace and I want to perform an analysis on the pricing of these items.
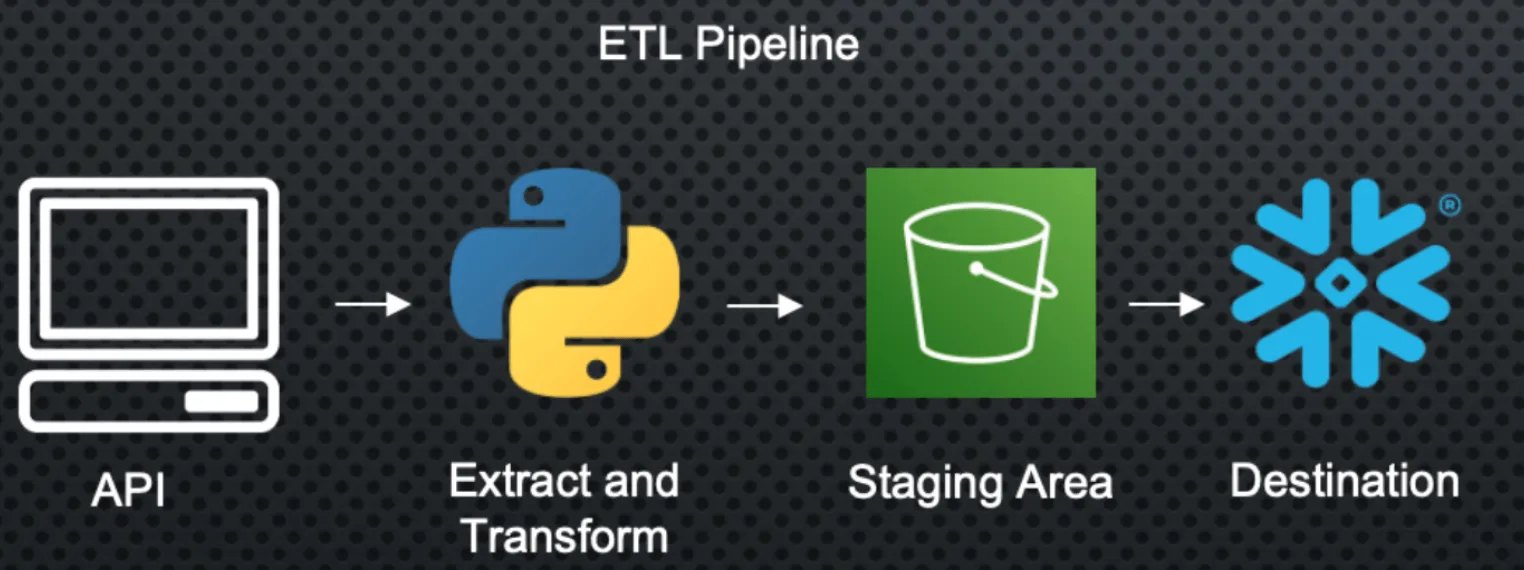
The process of building a data pipeline
The first step here is to hit an API or database and extract the data we are looking for using a python script I made.
This is awesome because now I have data!
The problem is that it’s not in the format that I necessarily want, so I need to perform some transformations to get that desired dataset.
Once I’ve done that, I can load that into a staging area like AWS S3 or Azure Blob for data storage. I call this a staging area because I want to use this as a stepping stone for my final destination.
To ensure this is reliable, I’ll want to build some tests, alerts, and backup plans in case something goes wrong or takes too long. Finally, my data warehouse will recognize new records in my staging area and ingest the new data to maintain a fresh dataset for analysts and data scientists within my organization.
Boom! Now I have my reporting and machine learning models connected to this final data source that is being fed data at the rate that I choose! The pipelines are in place, deployed, and I no longer need to touch them or ingest data manually (hopefully).
This is only one data source, but now I can go find other sources and see if I can bring in external sources via other pipelines to make my data stronger and to keep building on the data pipeline’s competitive advantage. Check out the code below to get a more in-depth look at ETL code.
import psycopg2
import csv
import boto3
import configparser
import os
import pandas as pd
from bs4 import BeautifulSoup
import requests
from time import time
from datetime import datetime

# config credentials from env
access_key_id = os.environ.get('AWS_ACCESS_KEY_ID')
aws_secret_access_key = os.environ.get('AWS_SECRET_ACCESS_KEY')
bucket_name = 'discog-data'

# scrape data
startTime = time()

url = '...'
page = requests.get(url)

soup = BeautifulSoup(page.content, 'html.parser')

results = soup.find(id="pjax_container")

record_elements = results.find_all("tr", class_="shortcut_navigable")

item_list = []
price_list = []
sellers_list = []
total_price_list = []
link_list = []

for record_element in record_elements:

    item_description = (record_element.find("a", class_="item_description_title"))
    item_list.append(item_description.text)
    price = (record_element.find("span", class_="price"))
    price_list.append(price.text)
    seller = record_element.find(lambda tag: tag.name == 'a' and tag.get('href') and tag.text and '/seller/' in tag.get('href'))
    sellers_list.append(seller)
    total_price = (record_element.find("span", class_="converted_price"))

    total_price_list.append(total_price)

    record_info = record_element.find(lambda tag: tag.name == 'a' and tag.get('href') and '/sell/' in tag.get('href'))
    link = record_element.find("a", class_="item_description_title", href=True)
    link_list.append(link['href'])

# create cols from item description
artists = [str(item).split('-')[0].rstrip() for item in item_list]
albums = [str(item).split('-')[1].lstrip() for item in item_list]
album_class = [str(item[item.find("(")+1:item.find(")")]) for item in item_list]

total_price_list = [item.text if item is not None else '0' for item in total_price_list]

my_dict = {'item_description': item_list,
           'artists': artists,
           'album': albums,
           'album_class': album_class,
           'seller': sellers_list,
           'price': price_list,
           'total price': total_price_list}

filename = f'discogs_market_data_{datetime.now().strftime("%Y%m%d-%H%M")}.csv'
df = pd.DataFrame(my_dict)
df.to_csv(filename, index=False)

# load file to S3
s3 = boto3.client('s3',
                  aws_access_key_id=access_key_id,
                  aws_secret_access_key=aws_secret_access_key)
s3_file = filename
s3.upload_file(filename, bucket_name, s3_file)

print(f' execution time: {(time() - startTime)}')