


A bead of sweat ran down my forehead as I moved my trembling finger over the button.
I’m not an army general who was about to launch a nuke and I wasn’t the commander at Space X about to shoot a rocket into space.
I’m just a business intelligence analyst who was merging a data model change into production. And yet, I imagine our stress levels were comparable.
I am exaggerating, of course.
But anyone who has been a data professional long enough knows how stressful making changes to existing models can be. Especially, if you’ve ever published a change that caused inaccuracies, bad data, or wrong conclusions.
Avoid loosing trust in your data when making data model changes
As a data analyst, there is nothing worse than stakeholders noticing data inaccuracies in production.
Seeing them lose trust in your data is something I wouldn’t wish on my worst enemy. That’s why you probably always double-check the data and hopefully even run automated tests to ensure no major mistakes snuck in.
Ensure your data model changes are correct
But oftentimes you may still experience lingering anxiety and worry that you overlooked something.
Fortunately, the simple solution is to compare the old and new in data model changes
This is one of the many policies we have adopted to ensure consistently high quality and accurate data at Infused Insight, a company helping businesses that use Infusionsoft to get more leads and sales through data insights. And the solution has been tremendously helpful.
We noticed an unintended change in the data the very first time we applied this policy. And it has proven immensely useful over and over ever since.
In theory, the solution was simple:
After making a change to a model’s query, the analyst should write down a hypothesis of how they expect the resulting data to change, such as:
“The ad’s call-to-action URLs that were previously NULL, should now contain a valid URL.”
Next, they should run a comparison on the result of the old and new query that compares all column values as well as detects all new and deleted rows.
Then, they check if only the expected changes were applied to the data. It seemed like this would be a very common task and that there should be plenty of tools (preferably open source) that could achieve it.
Pick correct tools to support your data model changes
The reality looked different.
There were a few tools that could do exactly what I wanted and provided a user-friendly UI, but they were closed source, fairly expensive, and most importantly, only available on Windows.
Our final solution was to create a Jupyter notebook that uses python, pandas, and datacompy to compare the old and new versions of a table. You can use it with any database that is supported by pandas or even with CSV files.
The result is a .txt file with a summary of the changes as well as a SQLite database that lets you query all changed columns and rows in detail.
And the SQLite data looks like this:
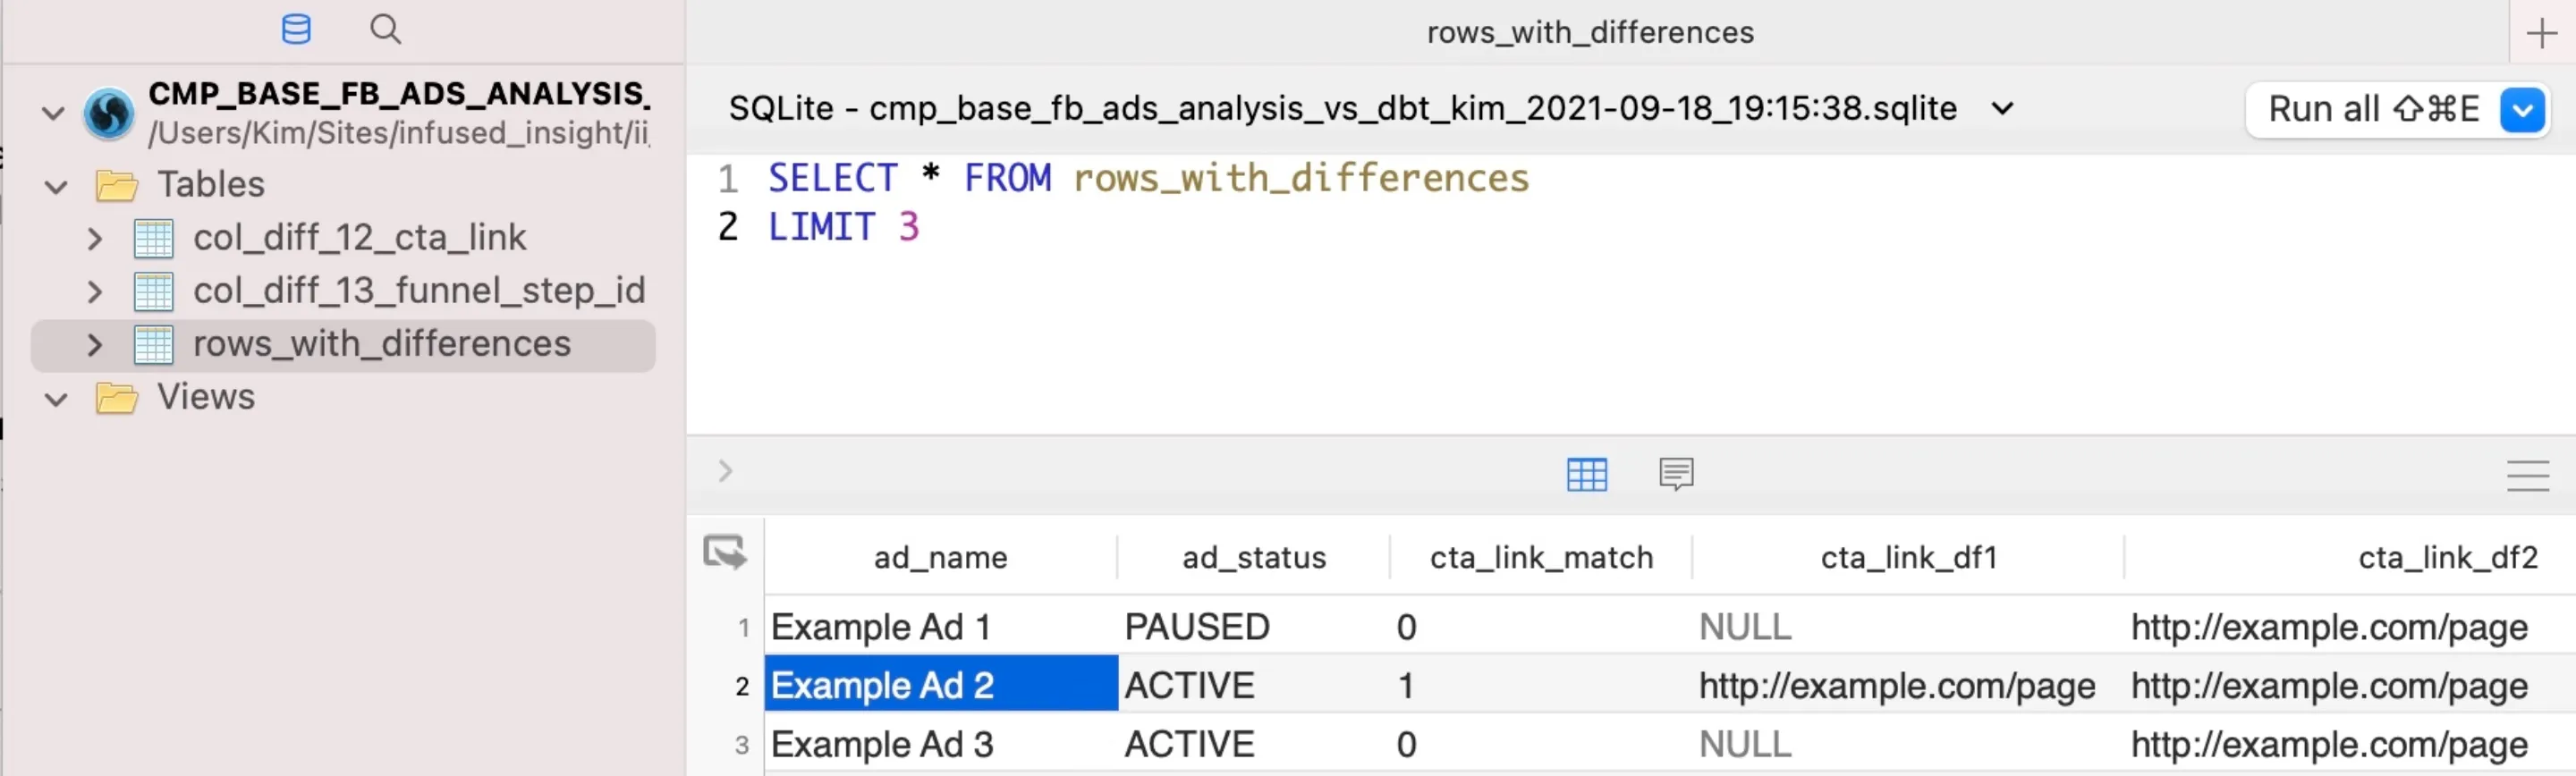
In the screenshot, you can see a query on the rows_with_differences table. This table includes all rows where differences between the two versions were found.
For columns that did have changes (such as the cta_link column), you get three columns (_match, _df1 and _df2) that let you see what the changes were and easily filter the data. But columns that had no changes across all rows (such as ad_name and ad_status), don’t have these additional columns.
This way you can see at a glance what changed, but can also put the changed data into context with the rest of the data for the row.
I have published the code as a Jupyter notebook on github and you can follow along below to learn.
How to do the same type of comparisons for your data model changes
First, you’ll need to download the code and install the python dependencies.
git clone git@github.com:Infused-Insight/sql_data_compare.git
cd sql_data_compare
pip install -r requirements.txt
Next, you are going to want to open the data_compare.ipynb file. You can either open it using the jupyter server…
jupyter notebook data_compare.ipynb
Or you can download VSCode and run it through there. That’s my preferred method. Once you open the jupyter notebook, you’ll need to adjust the settings.
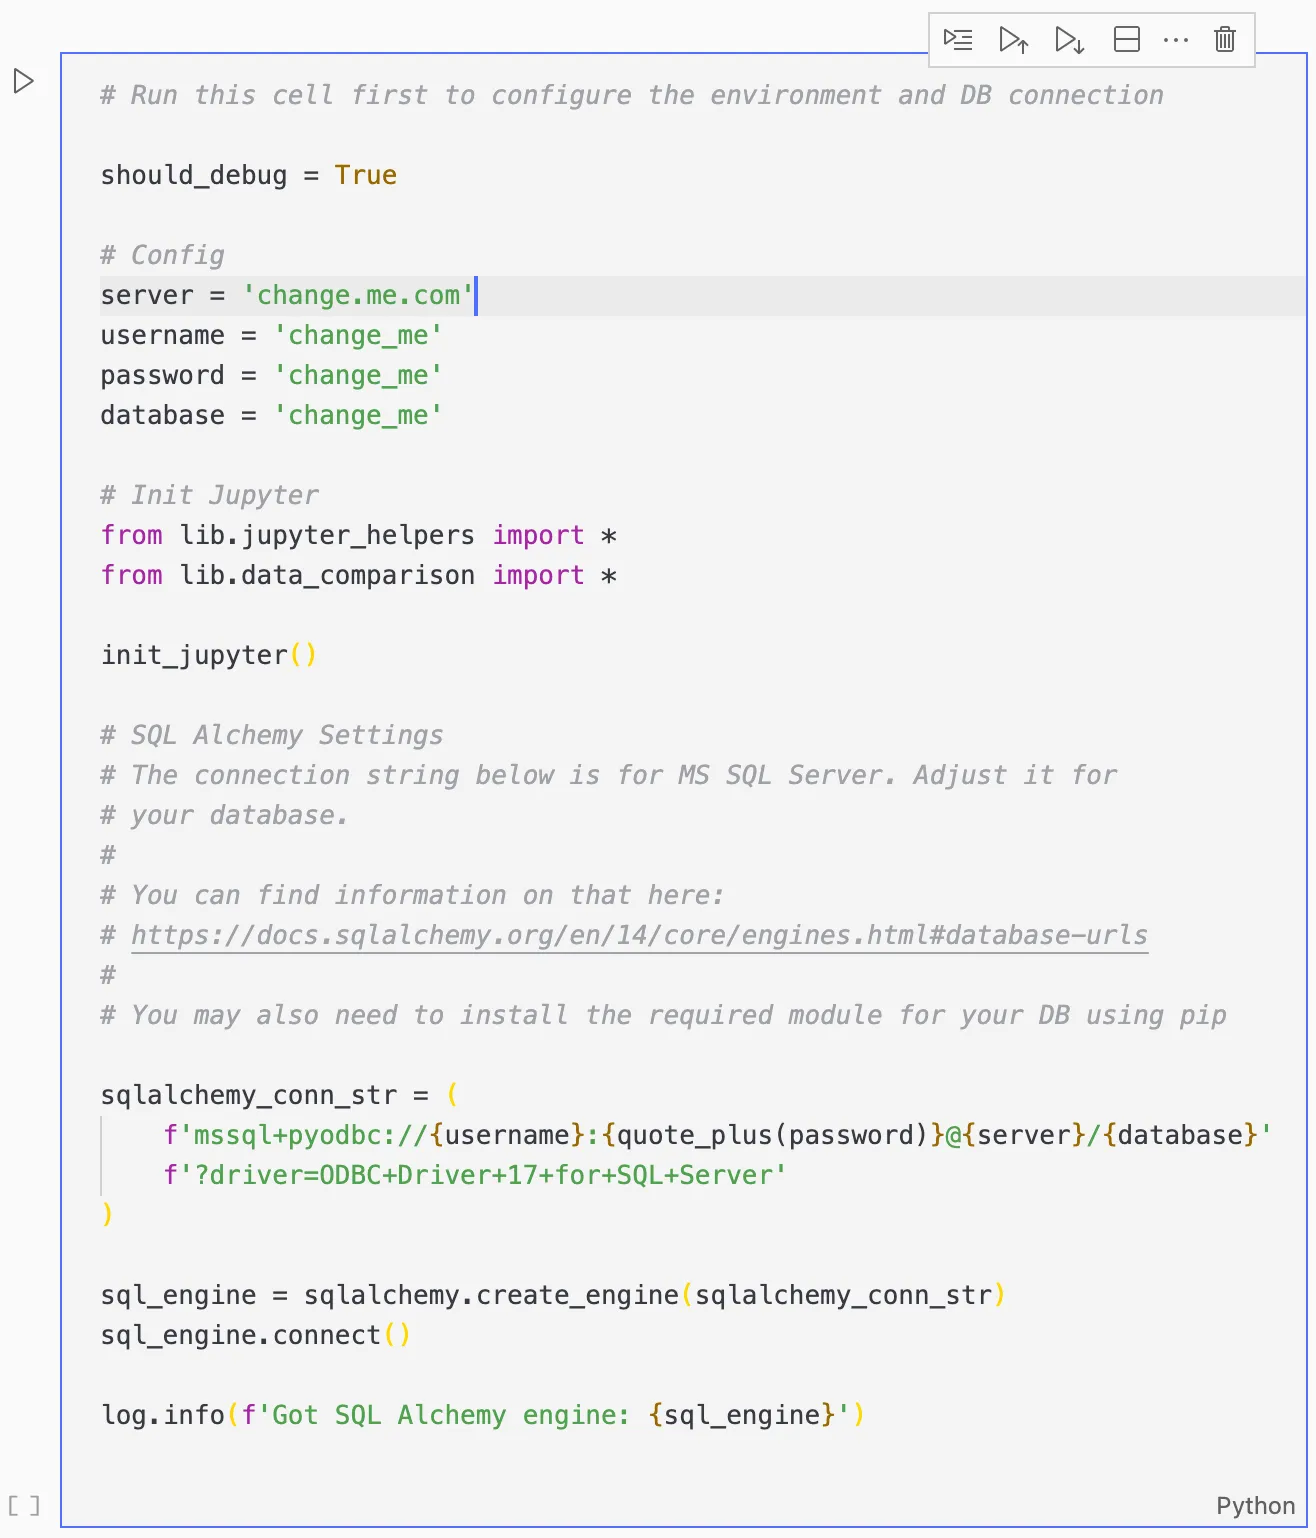
The solution uses python’s SQLAlchemy module to load the data from a SQL database, then compares it using pandas and datacompy, and finally writes the results to an SQLite database.
So the first step is to configure the SQL database settings and the SQLAlchemy connection string.
In the above example, it’s configured to connect to a MS SQL server, but you can change it to any database that SQLAlchemy supports.
You can refer to their database URL documentation for further details.
After that, you can start the comparison in the second jupyter cell.
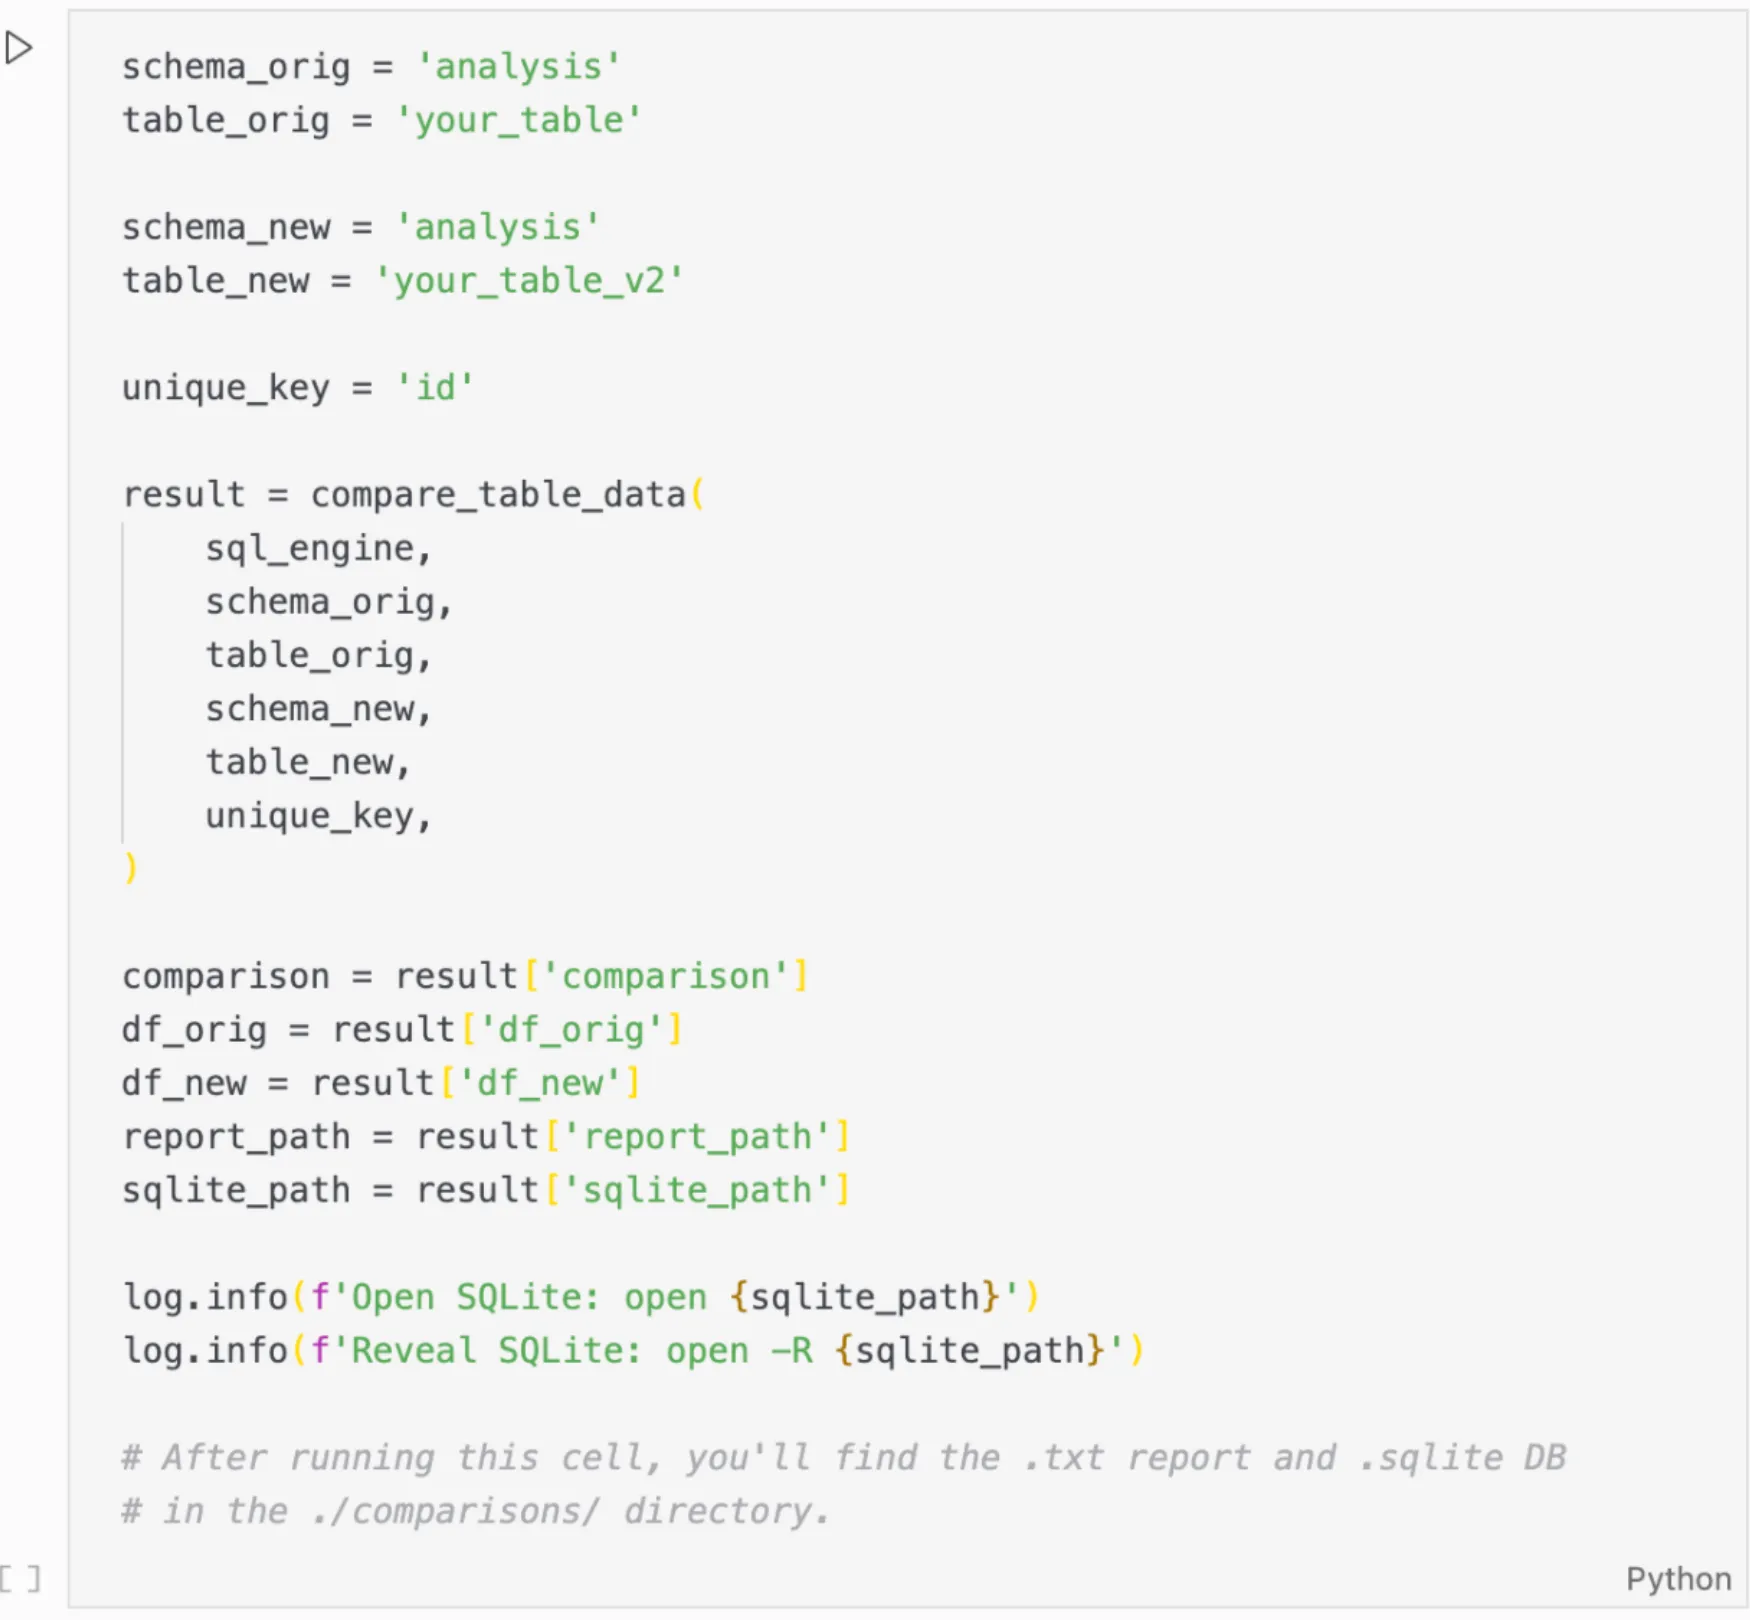
Simply adjust the settings and run it.
You will find the resulting report and SQLite database with the changes in the ./comparison/ directory.
Conclusion: Data model changes
I hope this simple solution will help you to avoid mistakes and give you the confidence to improve upon existing models without fear of breaking something.