

As an analytics agency, we love providing self-service analytics tools for our customers. The idea that business users can explore not only the dashboards we’ve prepared, but the entire dataset as well, is very powerful. But business users often struggle with getting started with self-service analytics.
In this post, we’ll illustrate the typical problem with the common Entity-Relationship data model in self-service, and discuss how to improve the self-service experience by using different data modeling techniques.
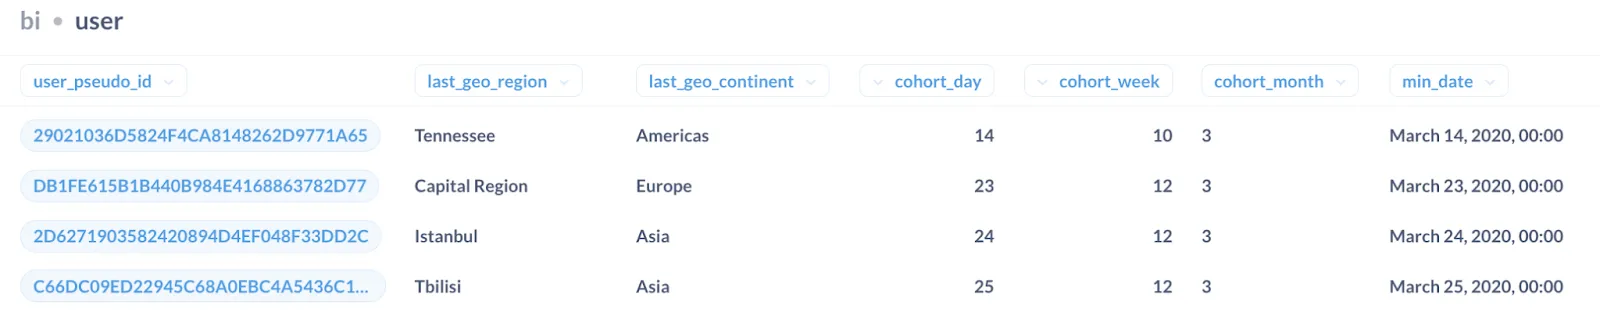
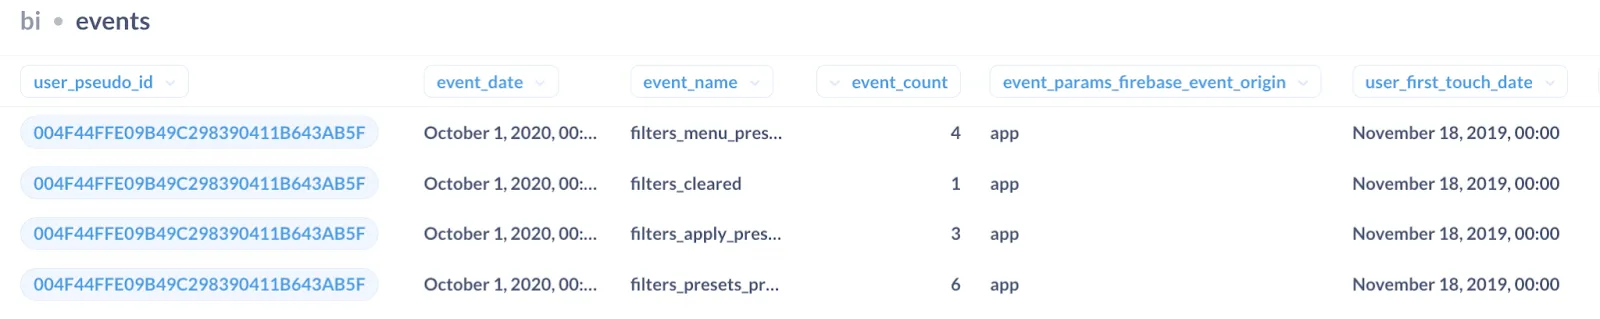
Imagine we have a typical dataset fetched from Google Analytics. We have information about Users and their Events. Usually we’ll have two tables for this kind of data: Users and Events.
Sample user dataset:
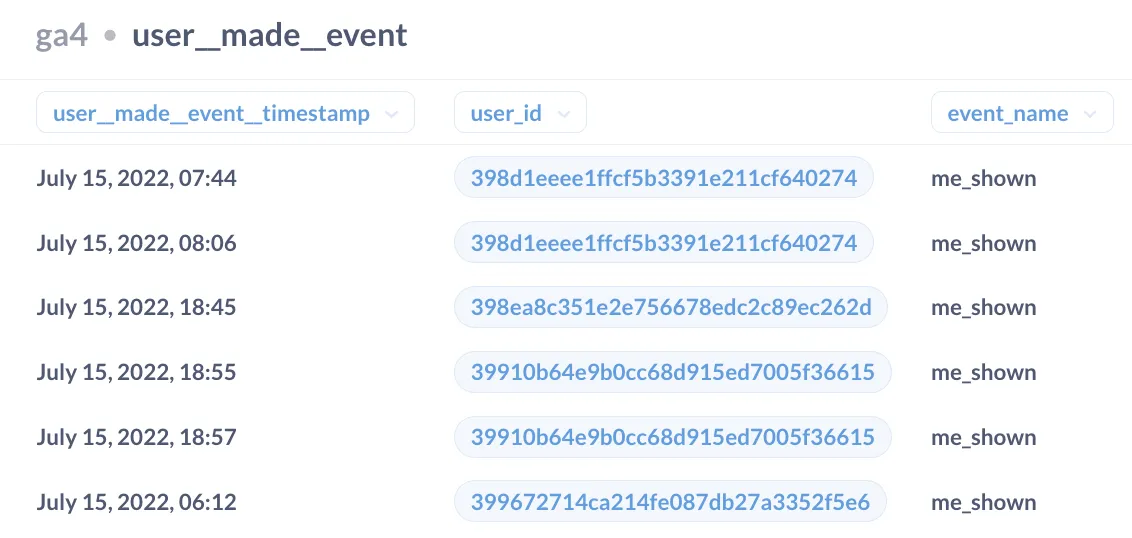
Sample events dataset:
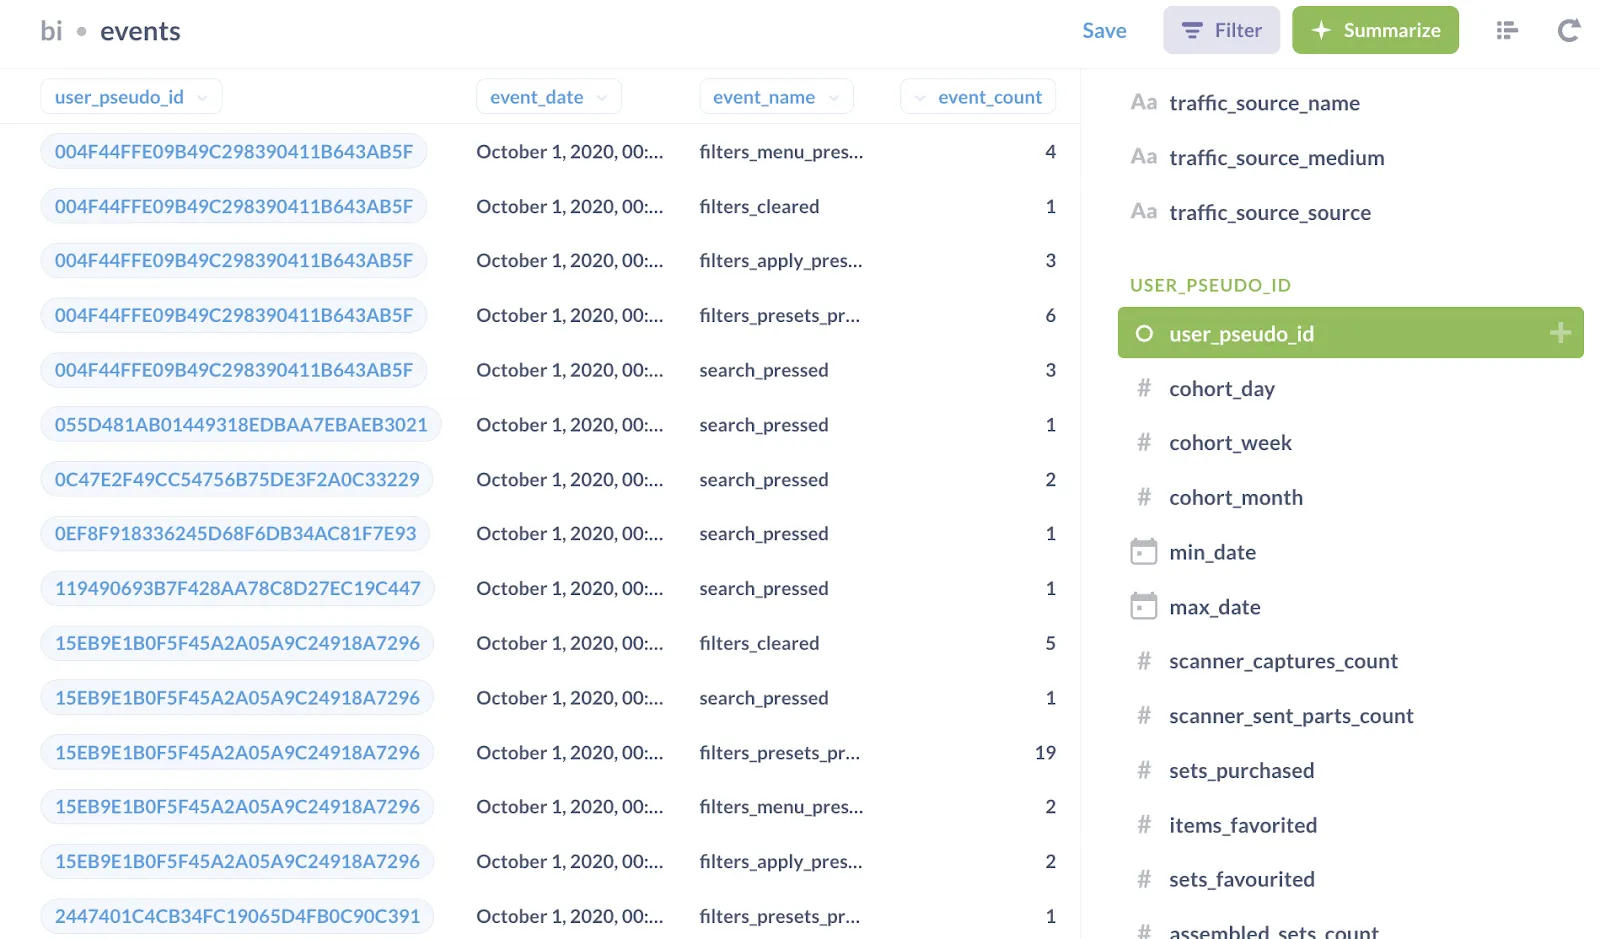
For self-service needs, we usually link the EVENTS table and USER table by primary-foreign keys, and get some USER attributes available from the EVENTS table.
This approach seemed reasonable, at least until the day when one of our customers asked to plot DAU (daily active users) for some management meeting.
“You can do it in self-service”, – we said. “Just go to the EVENTS table and count the number of distinct users by days”.
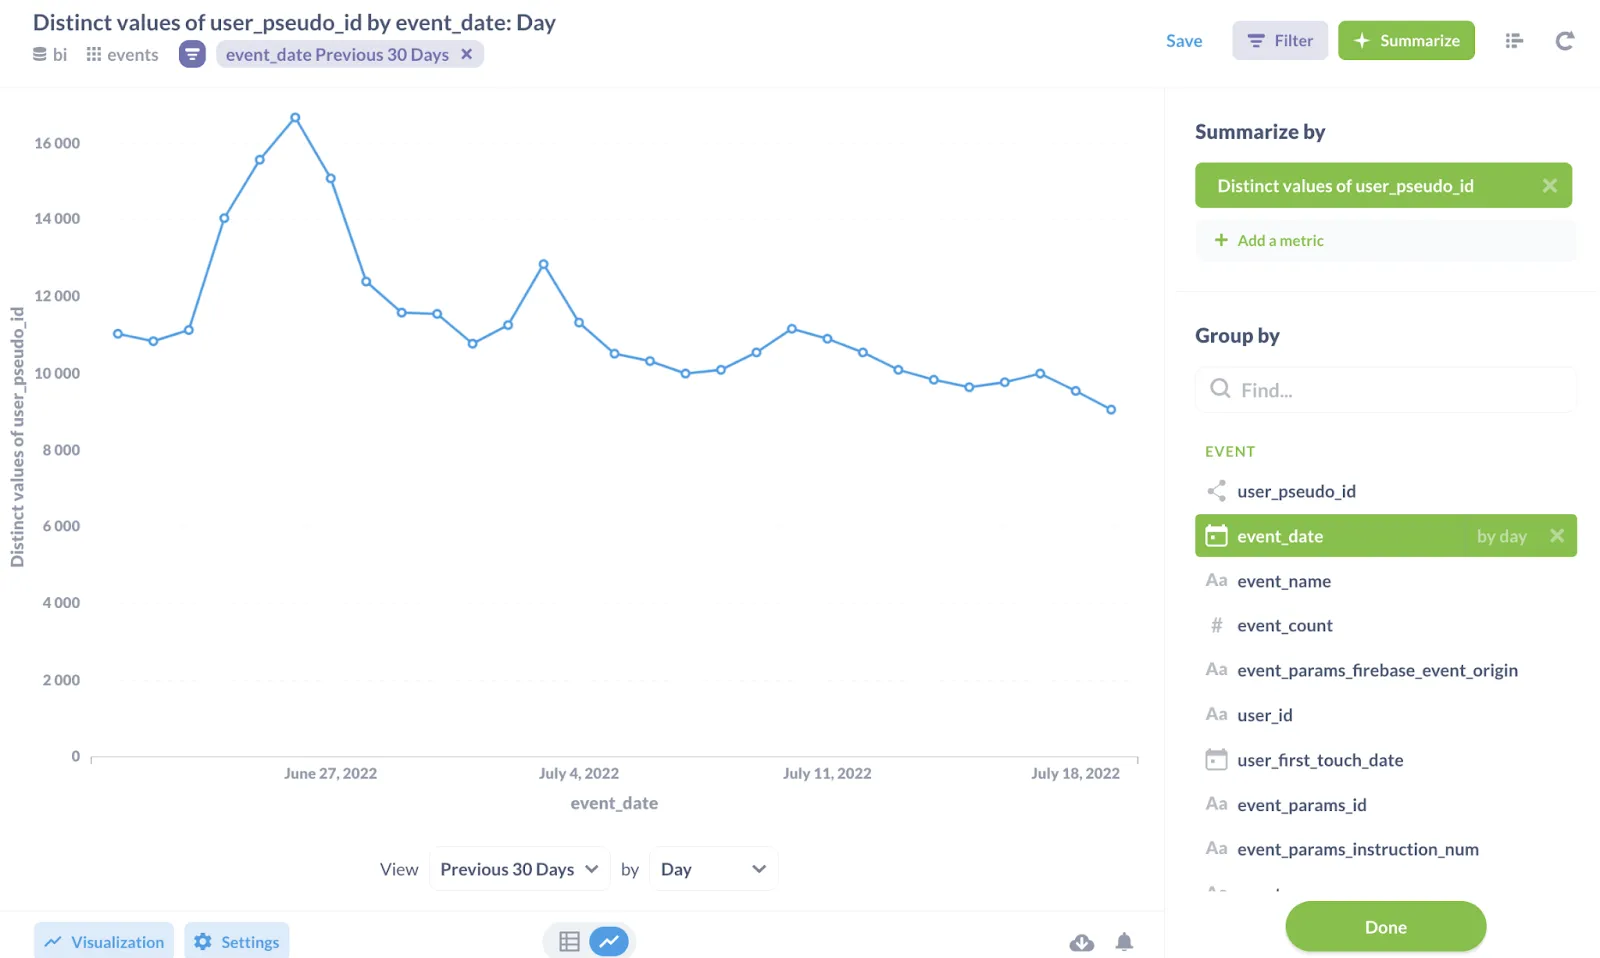
“But”, - the business user said, “If I want to plot Daily Active USERS, why should I go to the EVENTS table? I really don’t get it!”
And here’s the real blocker for self-service analytics development in the company – what might be obvious to engineers, isn’t necessarily obvious for core business users.
So we decided to find a data model which suits self-service needs better than the classic Entity-Relationship model.
After some exploration of data modeling techniques, we ran into the Minimal Modeling approach, which dissects the database into Anchors (the main nouns of the domain), Links between the Anchors, and Attributes.
One of the requirements of Minimal Modeling is to have a Link table separated from the Anchors tables.
So after remodeling our dataset, we get:
-
Anchor tables (USER and EVENT)

-
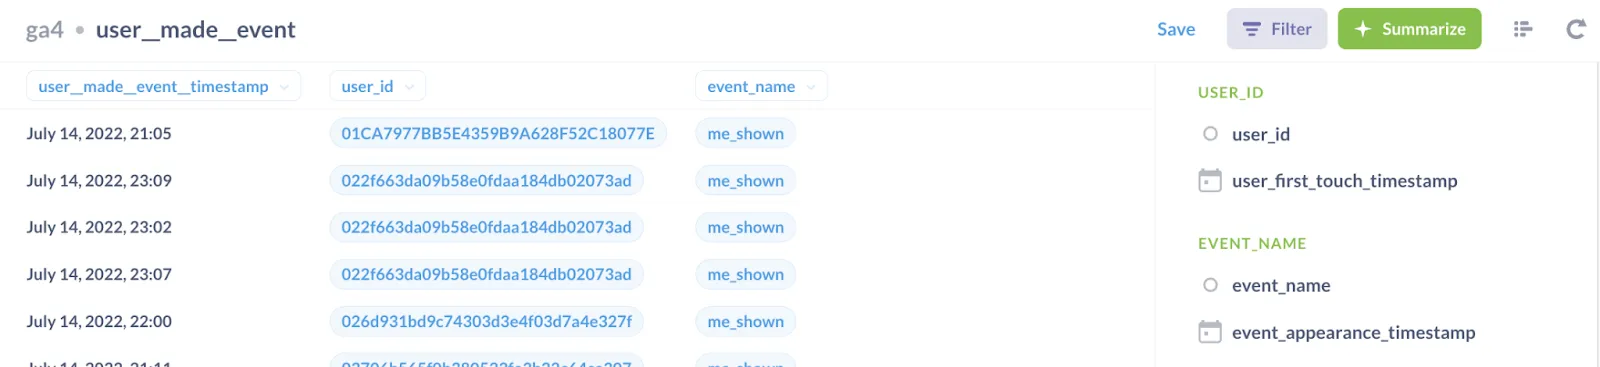
And a separate link table

This link table contains two id’s: user_id and event_id and a timestamp, when the event was made.
And here comes the trick: if we use this link table as the main table for self-service analytics, we can link both USER and EVENTS table to it.
So USER and EVENTS table will share the same rank in the Summarize sidebar.
So if a business user needs to plot Daily Active Users metric, he doesn’t have to guess where he should go: to the USERS table or to the EVENTS table. He goes to the link table, as an entry point.
Daily Active Users, built using a link table:
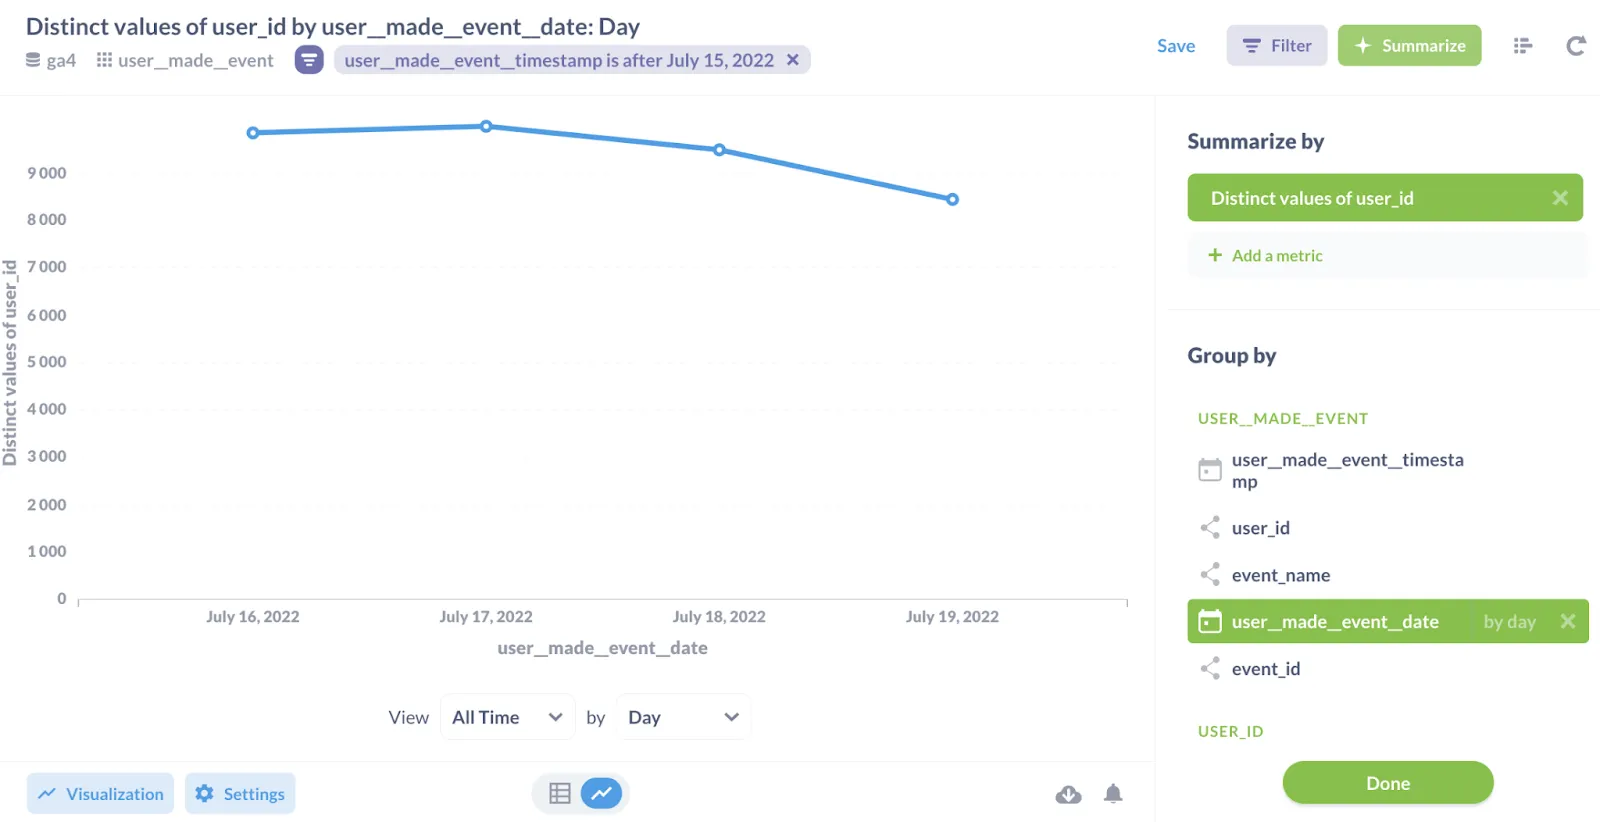
And the metrics for both USERS and EVENTS can be defined using only one link table. This idea of having one wide link table can be extended: if we have ORDERS, TRANSACTIONS and other domain anchors, they also can be linked together in the single link table, so it becomes a single point-of-entry for the self-service needs.