





What goes in an e-commerce sales dashboard in Metabase?
An e-commerce sales dashboard is the revenue roll-up for a store: net sales, orders, average order value, and where the revenue comes from. It's the daily number the whole team steers by. Build it from store data synced into a database — see Shopify, WooCommerce, or BigCommerce for the connection.
For: Founders, e-commerce managers, finance. Refresh: hourly to daily. Source: modeled orders with net totals, discounts, refunds, and channel.
What does an e-commerce sales dashboard look like?
Here’s the layout this guide builds: net revenue with its prior-period comparison at the top, then revenue and orders by week alongside average order value, then the mix cards that explain where the number came from — channel, region, discounting, and the products doing the work.
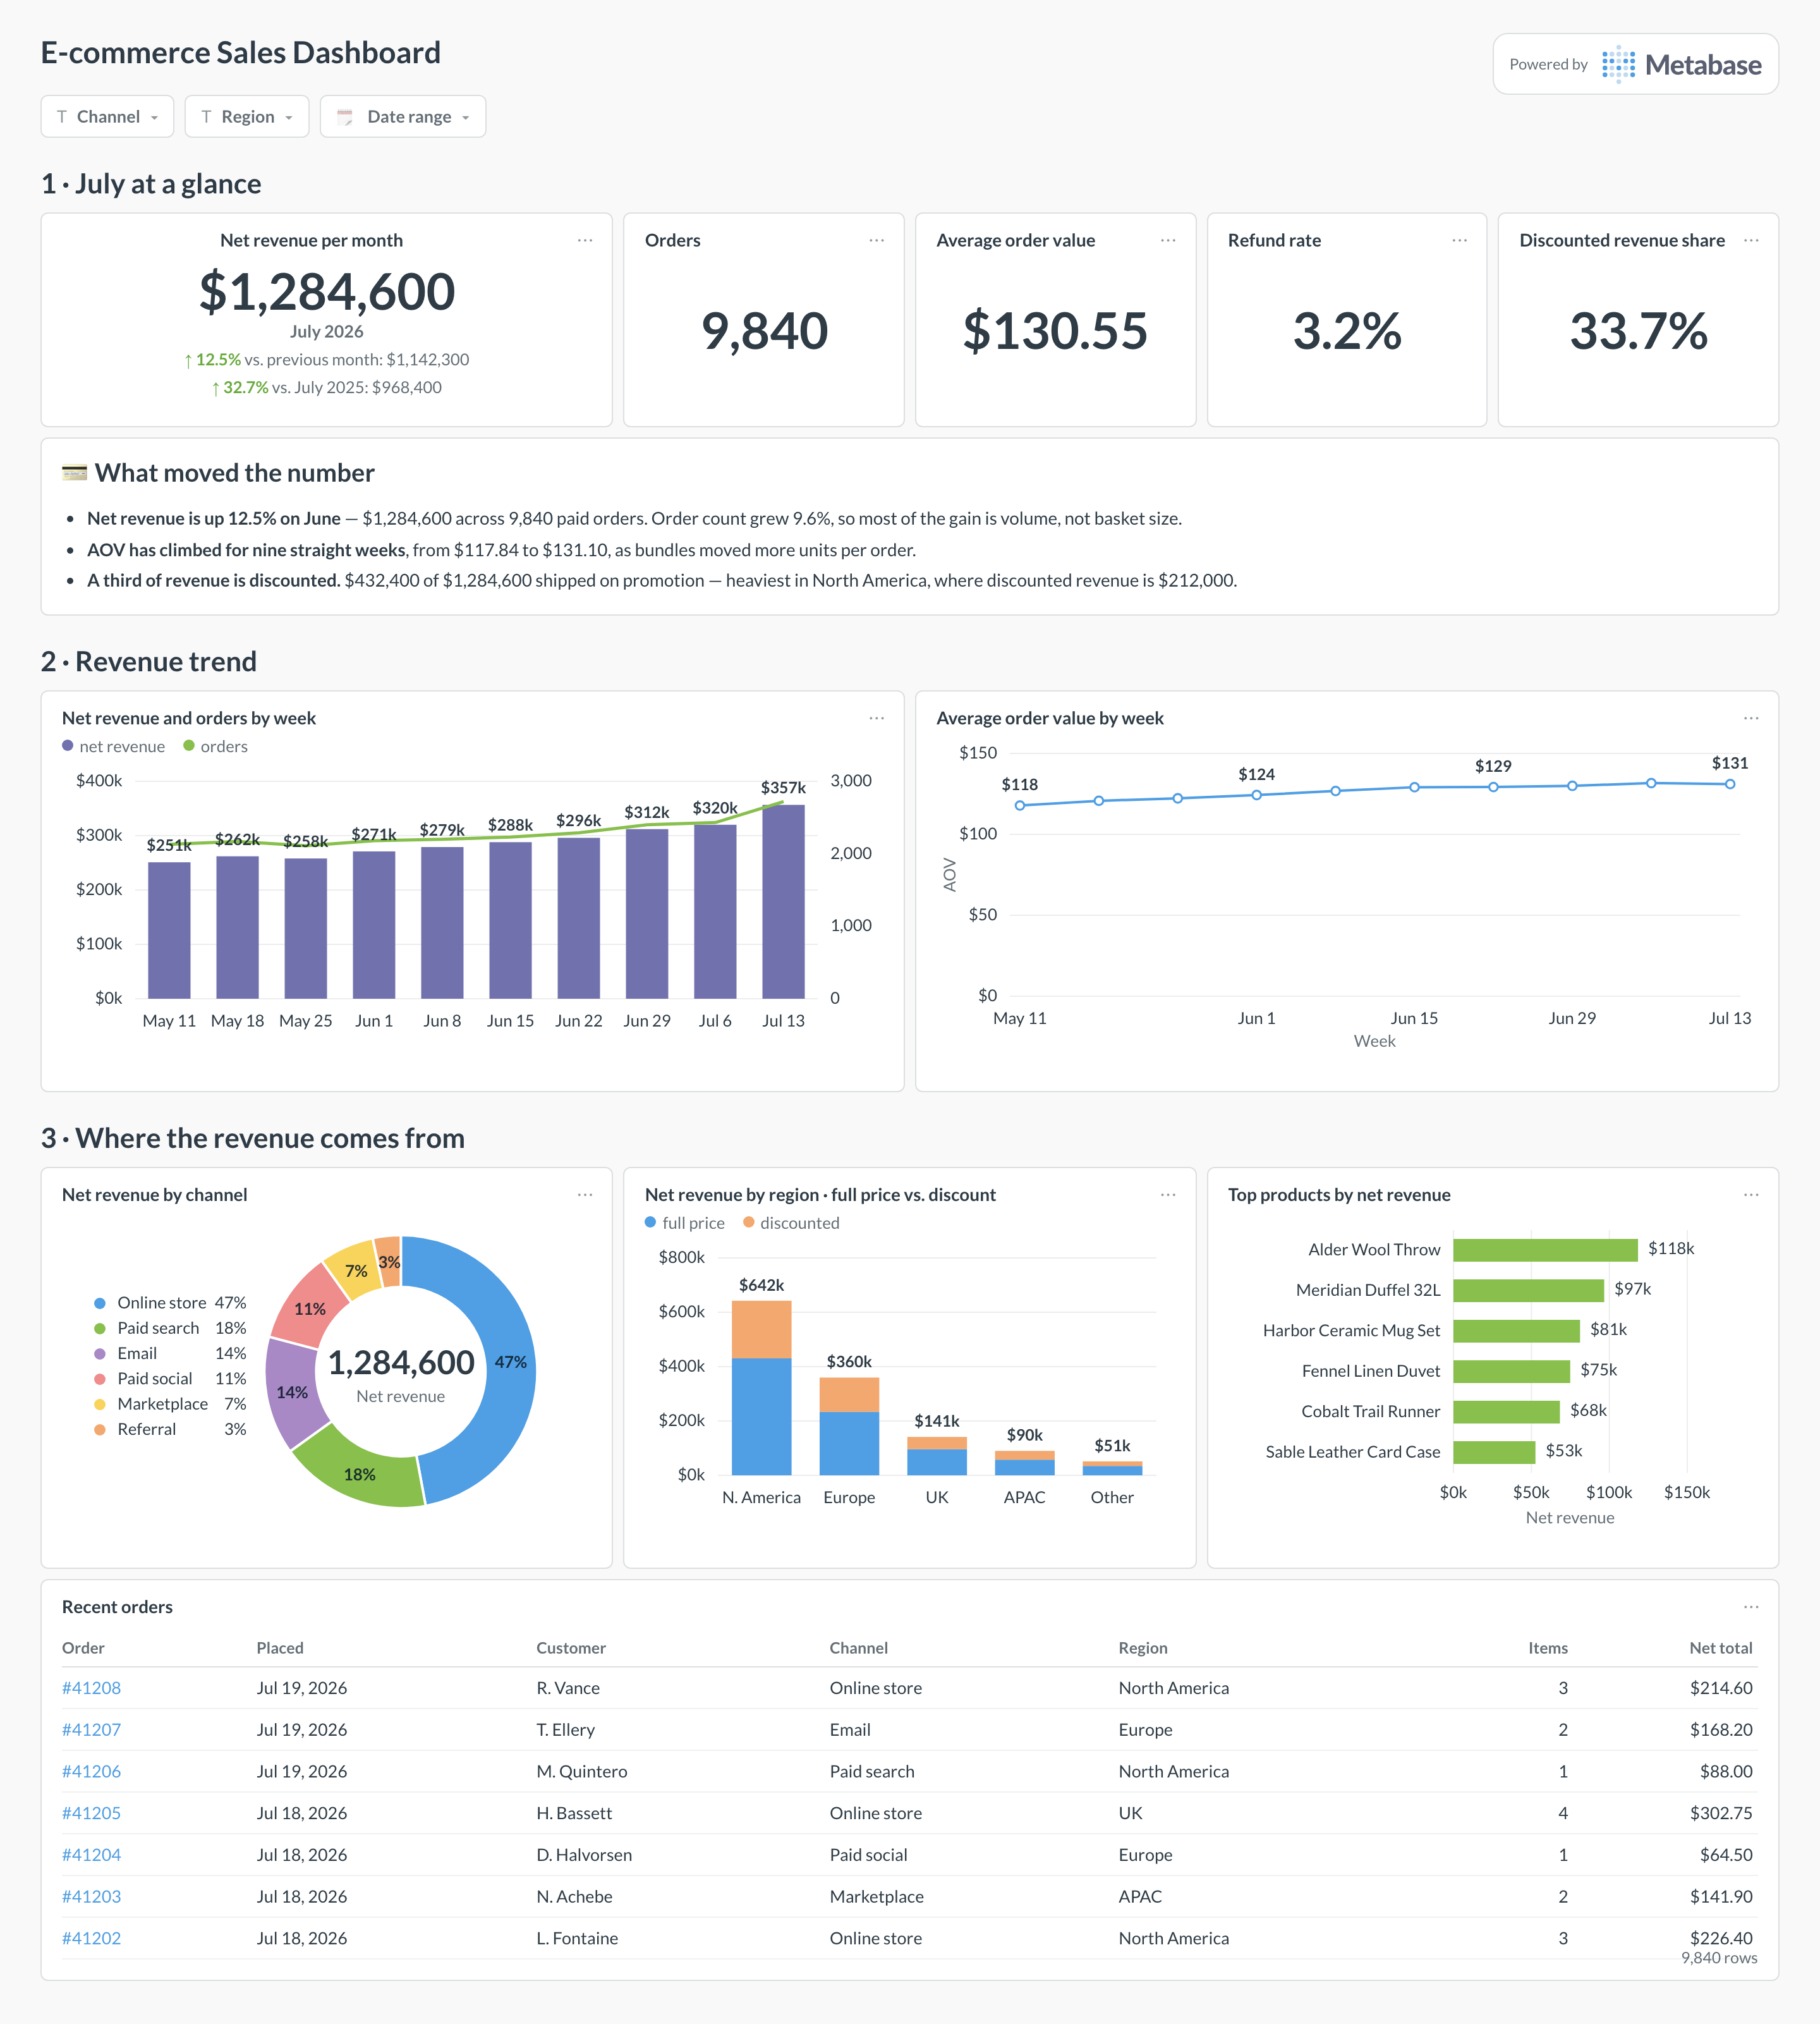
An example e-commerce sales dashboard in Metabase, built from Shopify, WooCommerce, or BigCommerce data. Figures are illustrative.
Which cards belong on an e-commerce sales dashboard?
Headline KPIs
- Net revenue (this period)
- Orders
- Average order value
- Refund rate
Trend & mix
- Net revenue by week (with prior-period comparison)
- Orders and AOV by week
- Revenue by channel / source
- Revenue by region and by discount vs. full price
- Top products by revenue (table)
What data does an e-commerce sales dashboard need?
- A modeled
orderstable with a monetary total, discounts, tax, shipping, and refunds. - A financial/payment status to exclude unpaid or cancelled orders.
- Channel, region, and campaign fields for the mix cards.
How do you build an e-commerce sales dashboard?
- Sync your store into a database (Shopify, WooCommerce, or BigCommerce).
- Define net revenue once — net of discounts and refunds, excluding tax and shipping — and reuse it.
- Build revenue, orders, and AOV cards; add prior-period comparisons.
- Add filters for channel, region, and date range.
Example card SQL
-- Net revenue, orders, and AOV by week.
SELECT
date_trunc('week', o.created_at)                        AS week,
COUNT(*)                                                AS orders,
ROUND(SUM(o.net_total), 2)                              AS net_revenue,
ROUND(SUM(o.net_total) / NULLIF(COUNT(*), 0), 2)        AS aov
FROM orders o
WHERE o.financial_status = 'paid'
GROUP BY date_trunc('week', o.created_at)
ORDER BY week;