





What is win rate, and how do you measure it in Metabase?
Win rate is the share of deals that close won out of the deals that reach a decision. It's the headline efficiency metric for a sales team — but it's only meaningful once you fix what goes in the denominator. Measure it in Metabase from CRM data synced into a database (HubSpot, Salesforce, Pipedrive, and others).
What does a win rate chart look like in Metabase?
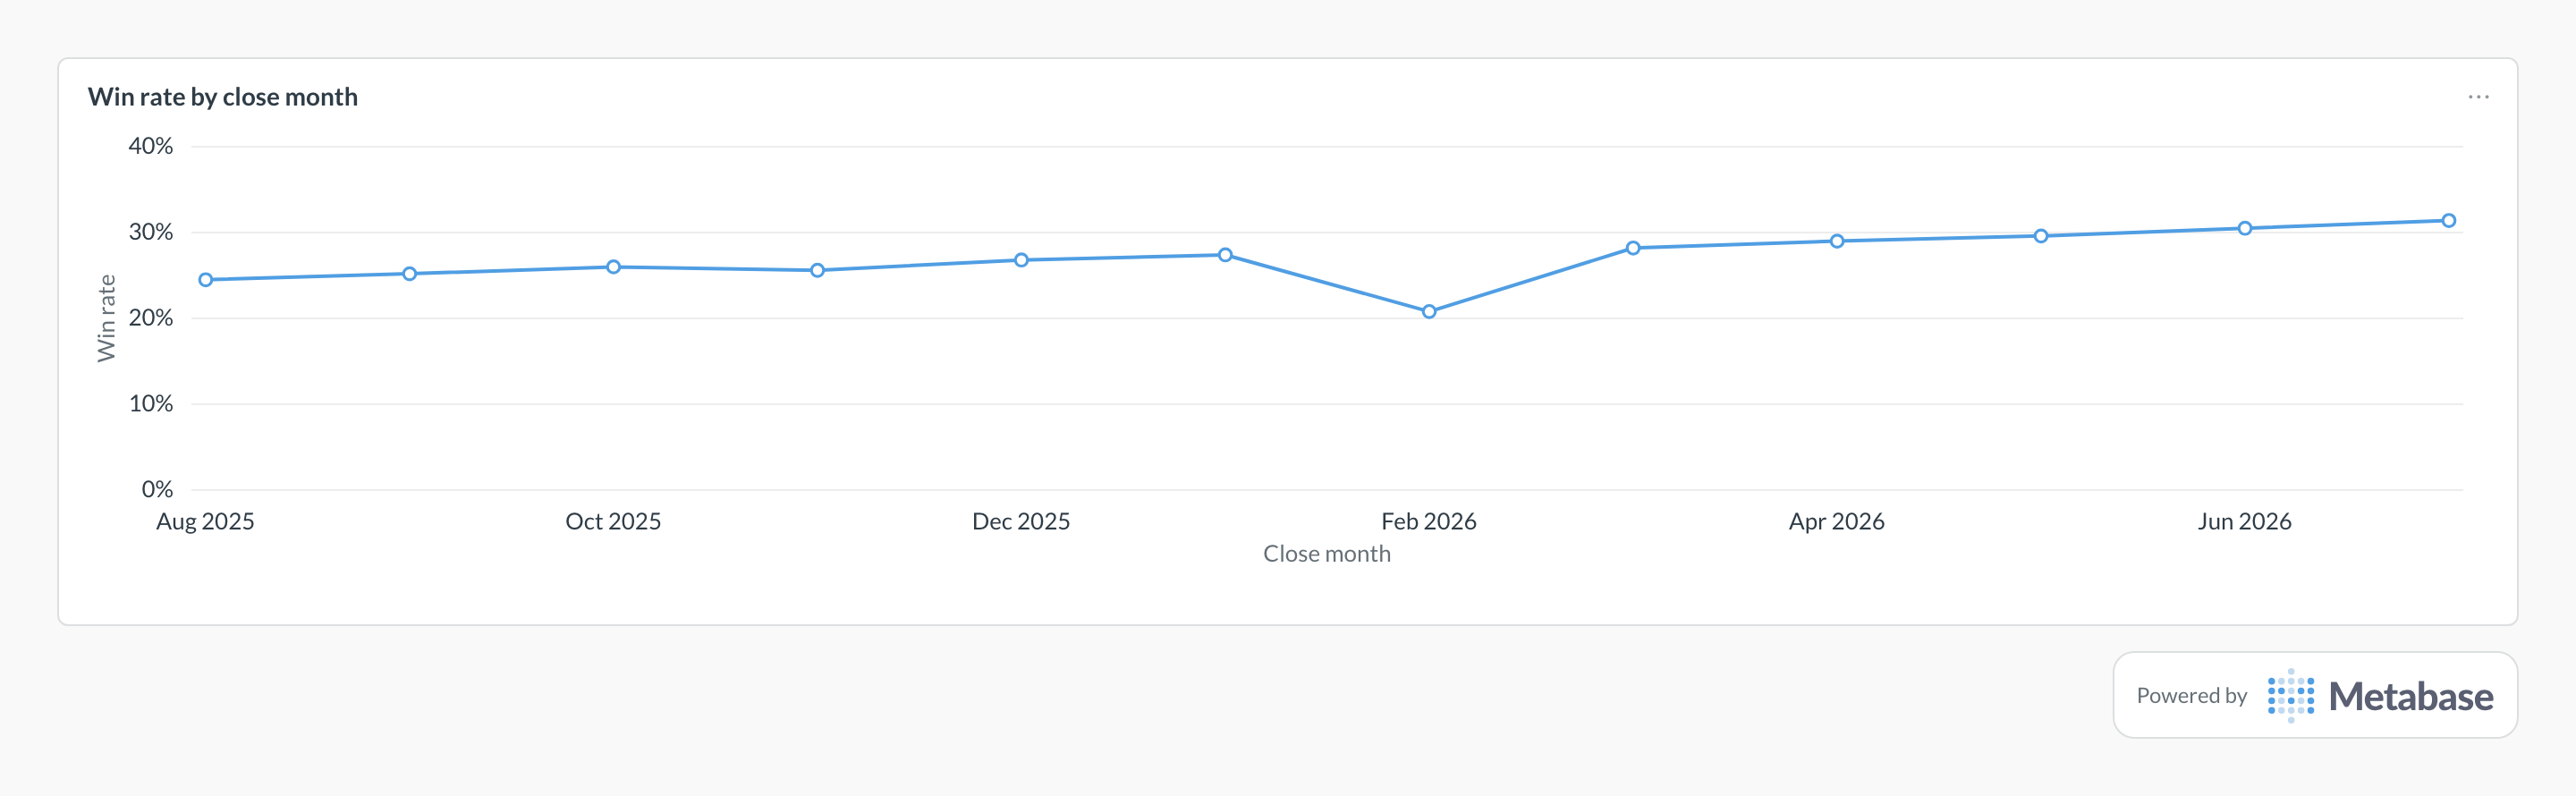
Plot won ÷ closed per close month as a line and read the slope: the climb from about 24% to 31% says qualification is tightening. A one-month crater like February's is usually a denominator artifact — a pipeline-hygiene purge marks a pile of stale deals closed-lost in one month — so check the closed count for that month before rereading it as a losing streak.
How is win rate defined?
The formula is simple; the definition of the denominator is where teams disagree:
- Won ÷ closed — of the deals that reached a decision (won or lost), how many were won. This is the most common and most stable.
- Won ÷ created — of all deals created in a cohort, how many eventually won. Lower and slower to settle, but useful for top-of-funnel quality.
Both are valid. What breaks reporting is switching between them, or leaving it ambiguous.
Choosing and holding a cohort
A win rate is meaningless without a cohort. Decide whether you're grouping by close date (deals that closed in the period) or creation date (deals created in the period, measured once they settle), and keep it consistent.
- Close-date cohorts answer "how are we converting deals right now?" — good for operational tracking.
- Creation-date cohorts answer "how good was this batch of pipeline?" — good for lead-quality analysis, but recent cohorts are incomplete.
What data does win rate need?
- A deal/opportunity table with a clear won/lost status.
-
A
closed_at(orcreated_at) timestamp for the cohort. - Segmentation columns: pipeline, source, owner, segment, and stage entered.
- A consistent rule for excluding open deals from the denominator.
SQL patterns
SELECT
  date_trunc('month', closed_at) AS month,
  COUNT(*) FILTER (WHERE is_won)                 AS won,
  COUNT(*) FILTER (WHERE is_closed)              AS closed,
  ROUND(
    100.0 * COUNT(*) FILTER (WHERE is_won)
      / NULLIF(COUNT(*) FILTER (WHERE is_closed), 0),
    1
  ) AS win_rate_pct
FROM modeled_deals
WHERE is_closed
  AND closed_at >= CURRENT_DATE - INTERVAL '12 months'
GROUP BY 1
ORDER BY 1;SELECT
pipeline,
source,
COUNT(*) FILTER (WHERE is_won) AS won,
COUNT(*) FILTER (WHERE is_closed) AS closed,
ROUND(
100.0 * COUNT(*) FILTER (WHERE is_won)
/ NULLIF(COUNT(*) FILTER (WHERE is_closed), 0),
1
) AS win_rate_pct
FROM modeled_deals
WHERE is_closed
GROUP BY pipeline, source
ORDER BY closed DESC;Pitfalls
Where this metric applies
- HubSpot + Metabase — deal stage and
is_closed_won - Salesforce + Metabase — opportunity
IsWon/IsClosed - Pipedrive + Metabase — deal
status(won/lost) - Close + Metabase — opportunity
status_type