





What goes in a churn & retention dashboard in Metabase?
A churn & retention dashboard shows where recurring revenue leaks and how much of it you keep. It's the counterweight to the MRR dashboard: growth only compounds if churn stays low. Build it from billing data synced into a database — see Stripe, Chargebee, or Recurly for the connection.
For: Finance, RevOps, product leaders. Refresh: daily. Source: a monthly MRR model plus subscription cancellation events and reasons.
What does a churn & retention dashboard look like?
Here’s the layout this guide builds: the retention headline first — revenue and logo churn, gross revenue retention, and net revenue retention against its target — then churn over time, then the cuts that say where the leak is. Read the top row monthly, and the segment, plan, and tenure cards when the headline moves.
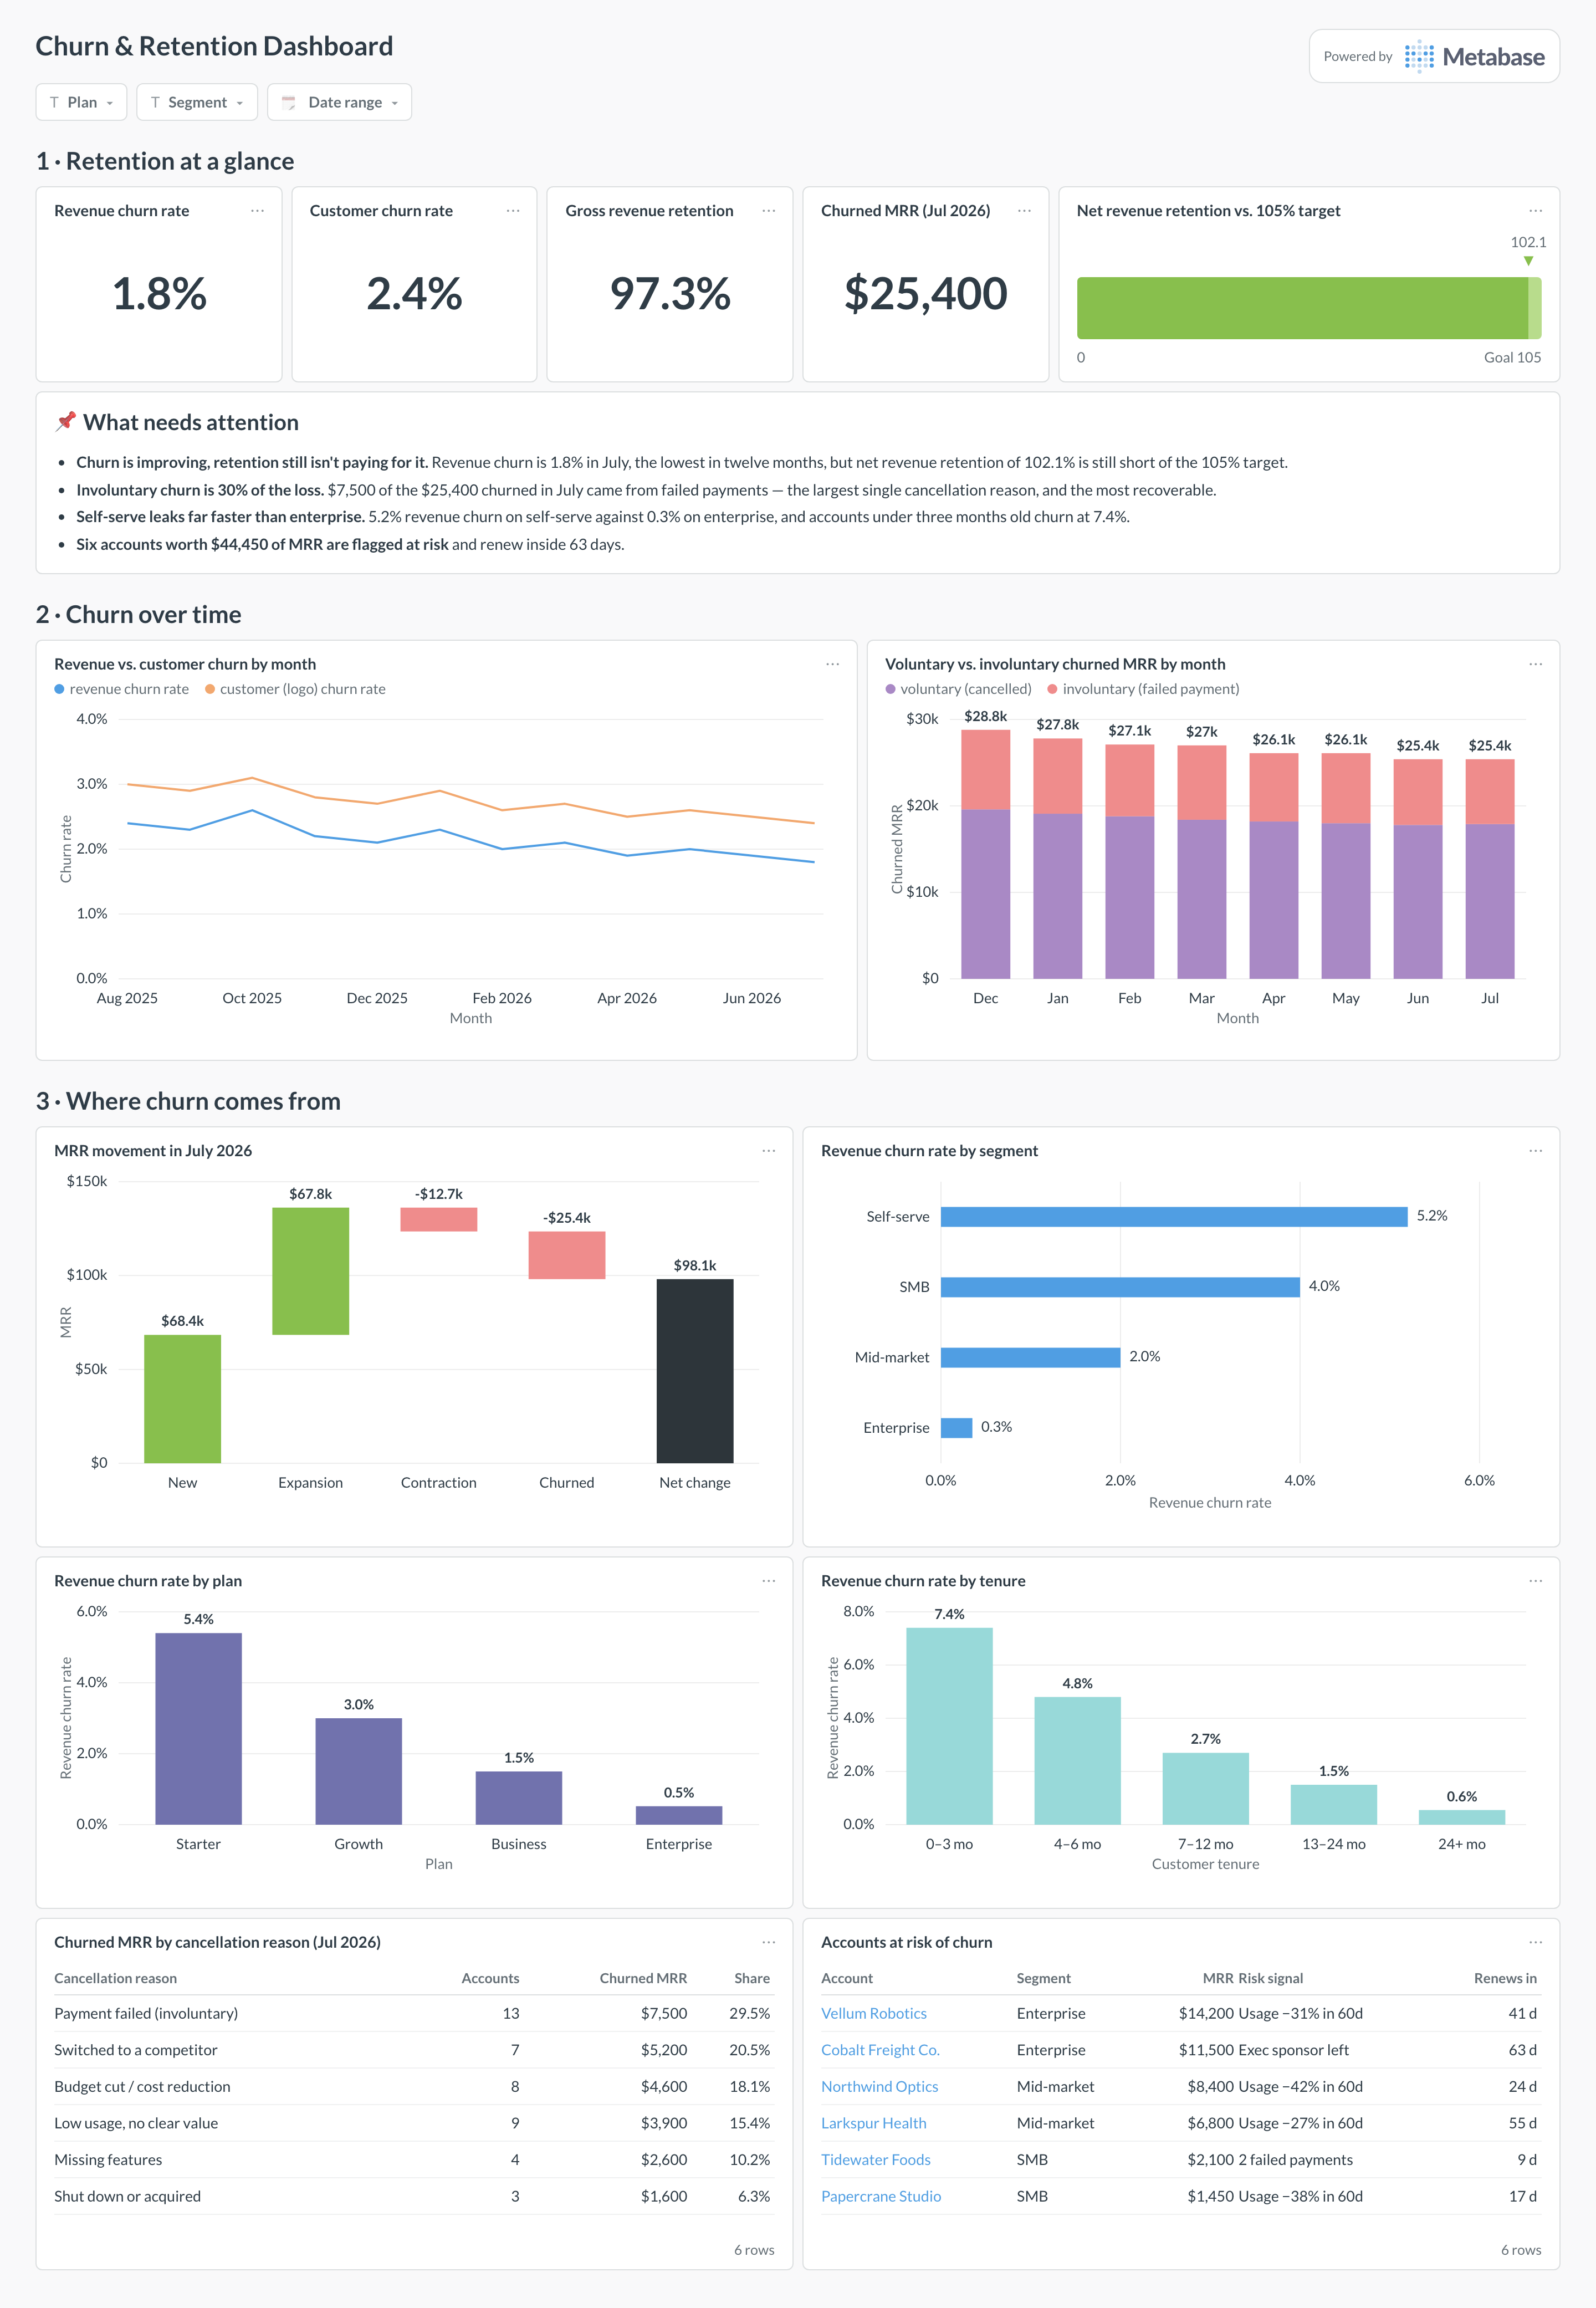
An example churn & retention dashboard in Metabase, built from Stripe or Chargebee billing data. Figures are illustrative.
Which cards belong on a churn & retention dashboard?
Headline KPIs
- Revenue churn rate (this month)
- Customer (logo) churn rate
- Net revenue retention
- Gross revenue retention
Trend & breakdown
- Revenue vs. customer churn by month
- Voluntary vs. involuntary churn — cancellations vs. failed payments
- Churn by plan, segment, and tenure
- Churned MRR by cancellation reason (table)
What data does a churn & retention dashboard need?
- A monthly MRR model for revenue churn and NRR.
- Subscription start and cancellation/expiry timestamps for customer churn.
- A cancellation reason or type to split voluntary from involuntary churn.
- Plan, segment, and signup-cohort attributes for the breakdowns.
How do you build a churn & retention dashboard?
- Sync your billing tool into a database (Stripe, Chargebee, or Recurly).
- Model monthly MRR and measure loss against the cohort that existed at the start of each period, not the end.
- Tag cancellations by cause so voluntary and involuntary churn separate.
- Create one card per metric; add filters for plan, segment, and date.
Example card SQL
-- Revenue churn and net revenue retention by month,
-- from a monthly MRR model.
WITH by_month AS (
SELECT
  month,
  SUM(mrr)                                              AS mrr,
  LAG(SUM(mrr)) OVER (ORDER BY month)                   AS start_mrr,
  SUM(churned_mrr)                                      AS churned_mrr,
  SUM(expansion_mrr)                                    AS expansion_mrr,
  SUM(contraction_mrr)                                  AS contraction_mrr
FROM modeled_mrr
GROUP BY month
)
SELECT
month,
ROUND(100.0 * churned_mrr / NULLIF(start_mrr, 0), 2)    AS revenue_churn_pct,
ROUND(100.0 * (start_mrr + expansion_mrr - contraction_mrr - churned_mrr)
      / NULLIF(start_mrr, 0), 2)                        AS nrr_pct
FROM by_month
ORDER BY month;