





What goes in a sales forecast dashboard in Metabase?
A sales forecast dashboard turns your open pipeline into an expected number for the period — weighted vs. unweighted, commit vs. best-case — and checks it against target and past accuracy. Build it from CRM data synced into a database — see HubSpot or Salesforce for the connection.
For: Sales leaders, RevOps, finance. Refresh: daily, with periodic snapshots for accuracy. Source: modeled deals with stage, amount, expected close, and stage probabilities.
What does a sales forecast dashboard look like?
Here’s the layout this guide builds, at the grain of one quarter: the expected number and its coverage of the gap at the top, then commit against best case and quota, then where the open pipeline actually sits by rep, segment, and stage. Read it in the weekly forecast call.
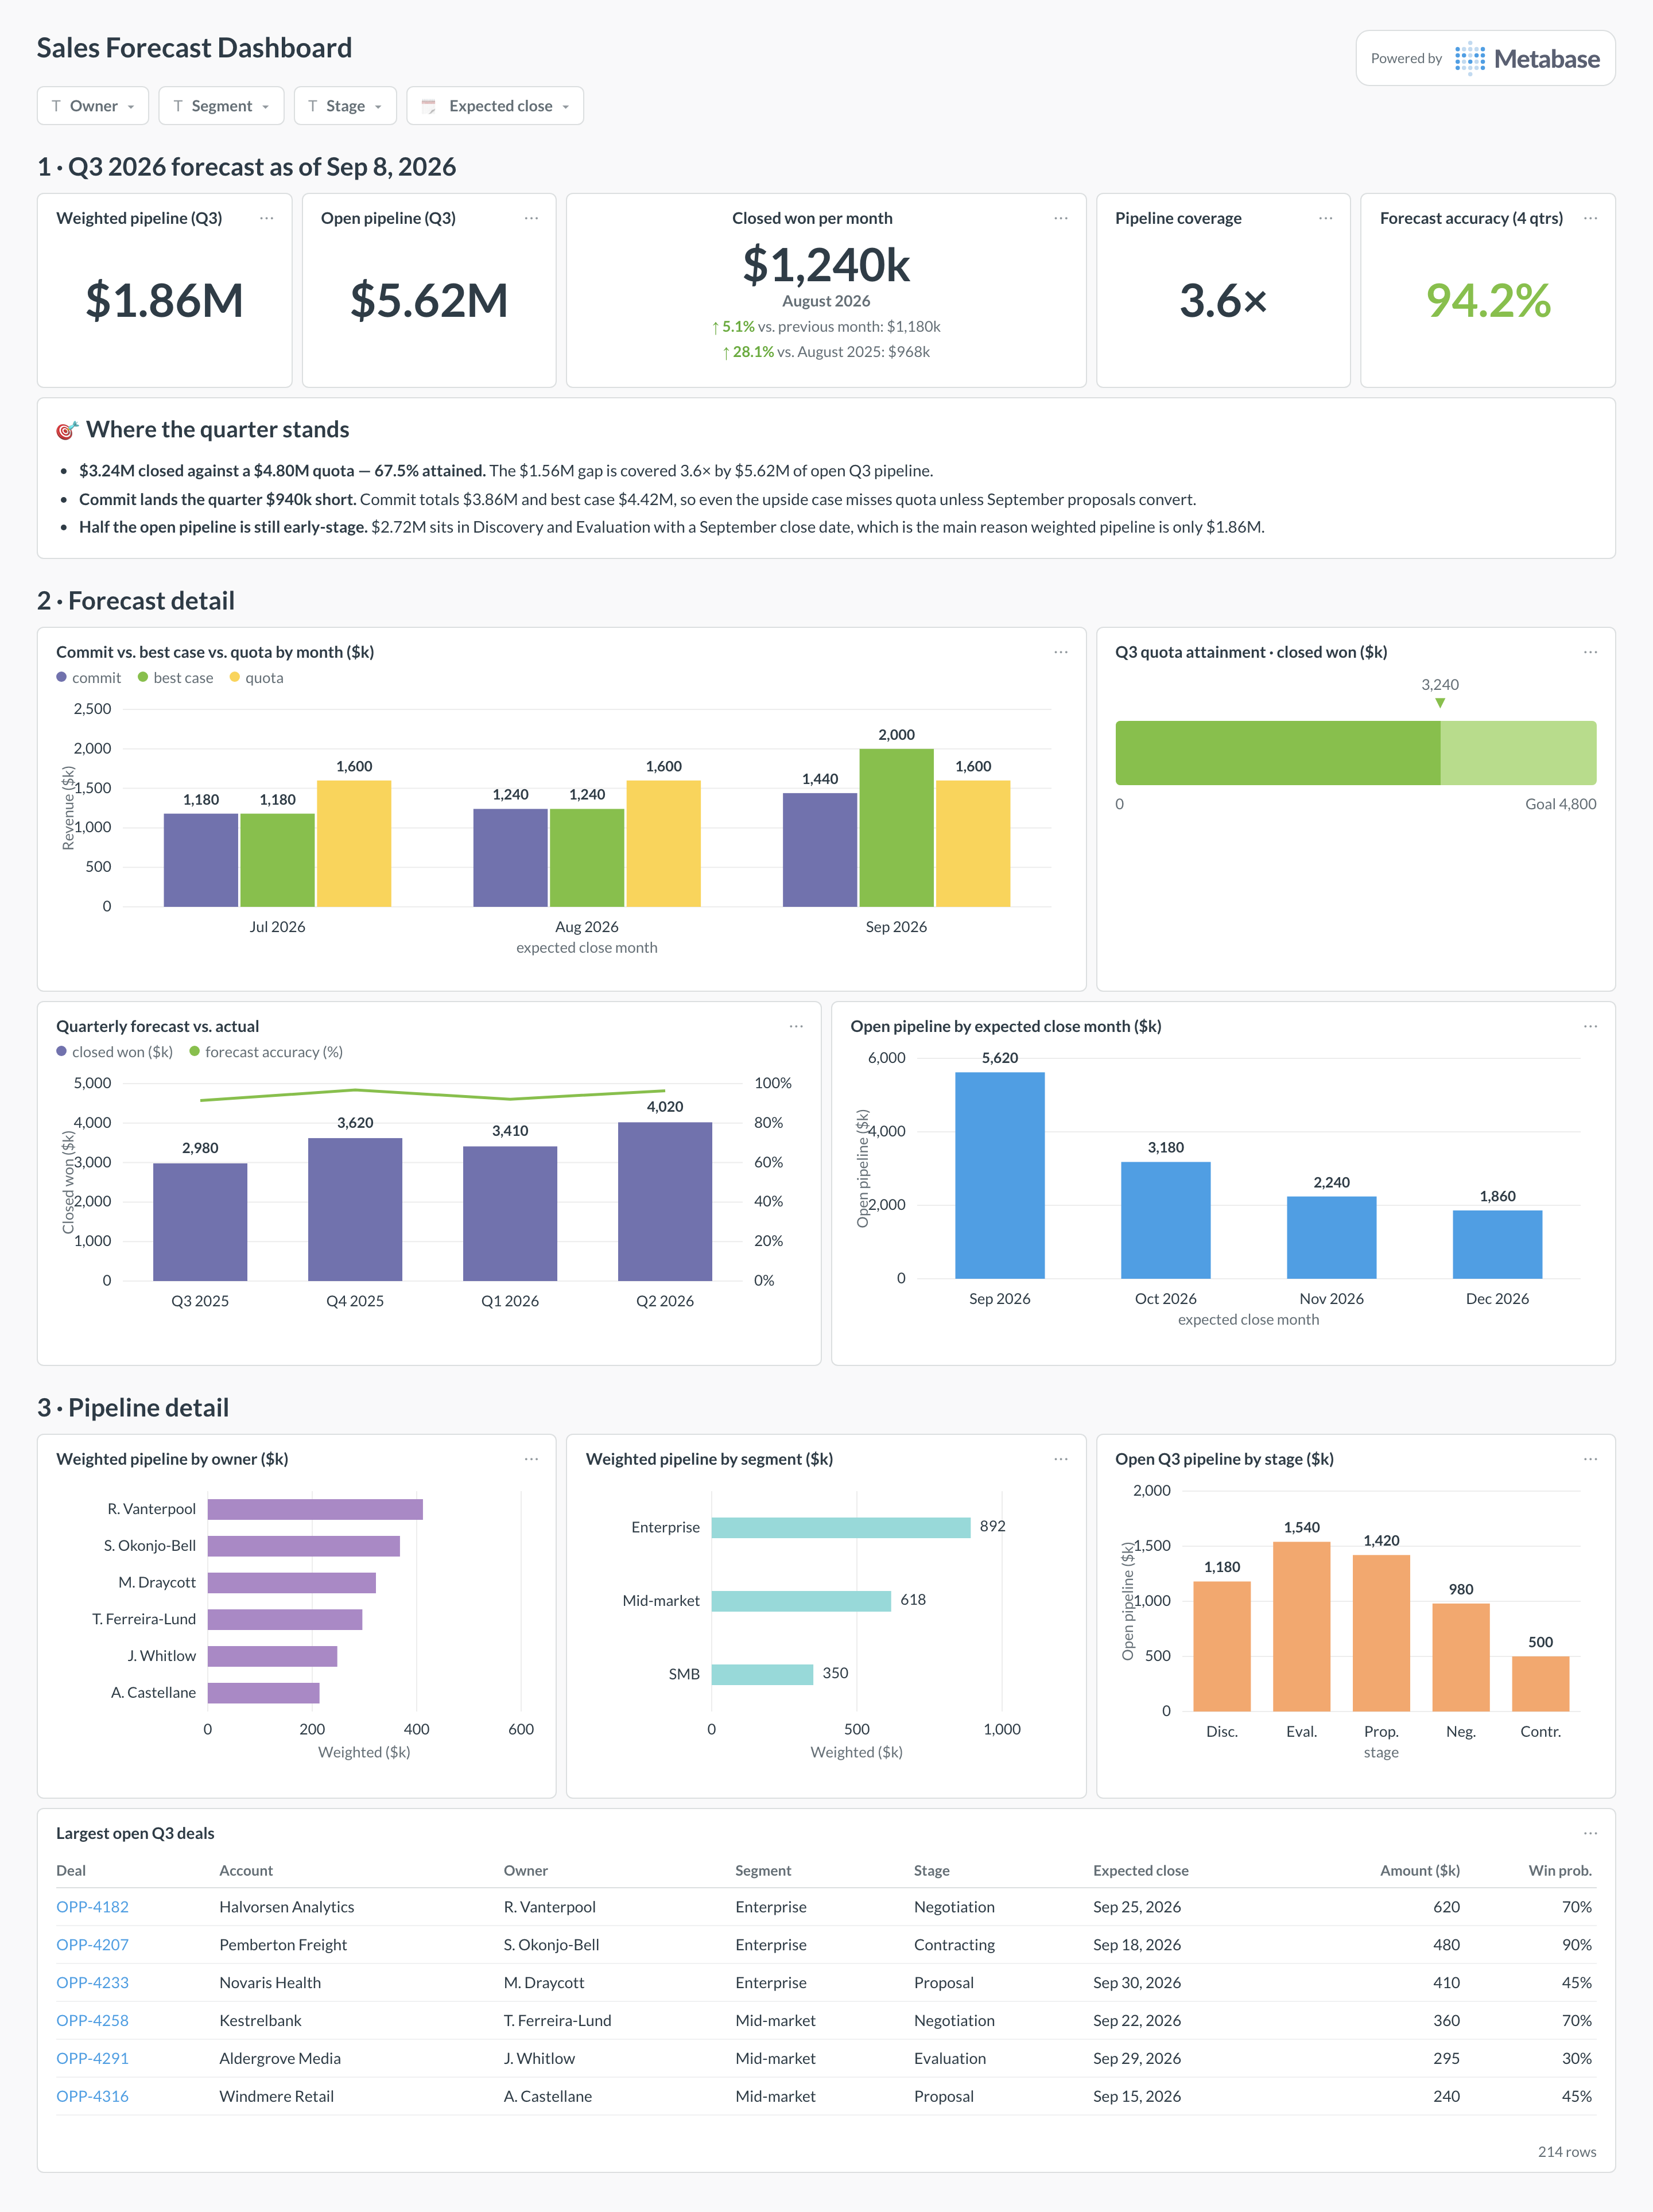
An example sales forecast dashboard in Metabase, built from HubSpot or Salesforce data. Figures are illustrative.
Which cards belong on a forecast dashboard?
Headline KPIs
- Weighted pipeline (expected revenue) for the period
- Unweighted open pipeline
- Pipeline coverage vs. target
- Attainment to date (closed won ÷ target)
Forecast detail
- Commit vs. best-case vs. target
- Weighted pipeline by owner and by segment
- Pipeline by expected close month
- Forecast accuracy vs. prior periods
What data does a forecast dashboard need?
- A modeled
dealstable with stage, amount, and expected close date. - Stage win probabilities (from the CRM or modeled from history).
- Periodic snapshots of the pipeline for forecast accuracy — you can’t reconstruct a past forecast from current state alone.
- A target/quota per period, owner, or segment.
How do you build a forecast dashboard?
- Sync your CRM into a database (HubSpot or Salesforce).
- Weight open deals by stage probability; compare to unweighted pipeline.
- Snapshot the pipeline on a schedule so you can measure forecast accuracy.
- Add filters for owner, segment, and expected-close period.
Example card SQL
-- Weighted vs. unweighted open pipeline for the current quarter,
-- weighting each open deal by its stage probability.
SELECT
d.owner,
ROUND(SUM(d.amount), 2)                                 AS unweighted_pipeline,
ROUND(SUM(d.amount * s.win_probability), 2)             AS weighted_pipeline
FROM deals d
JOIN stages s ON s.name = d.stage
WHERE d.stage NOT IN ('won', 'lost')
AND d.expected_close_at >= date_trunc('quarter', CURRENT_DATE)
AND d.expected_close_at <  date_trunc('quarter', CURRENT_DATE) + INTERVAL '3 months'
GROUP BY d.owner
ORDER BY weighted_pipeline DESC;