Metabase makes it easy for everyone to build a dashboard for Sales Teams.
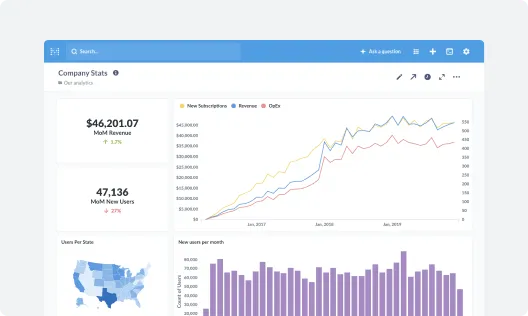
A sales team dashboard collects your team’s most important metrics in one easy-to-understand format.
Get Started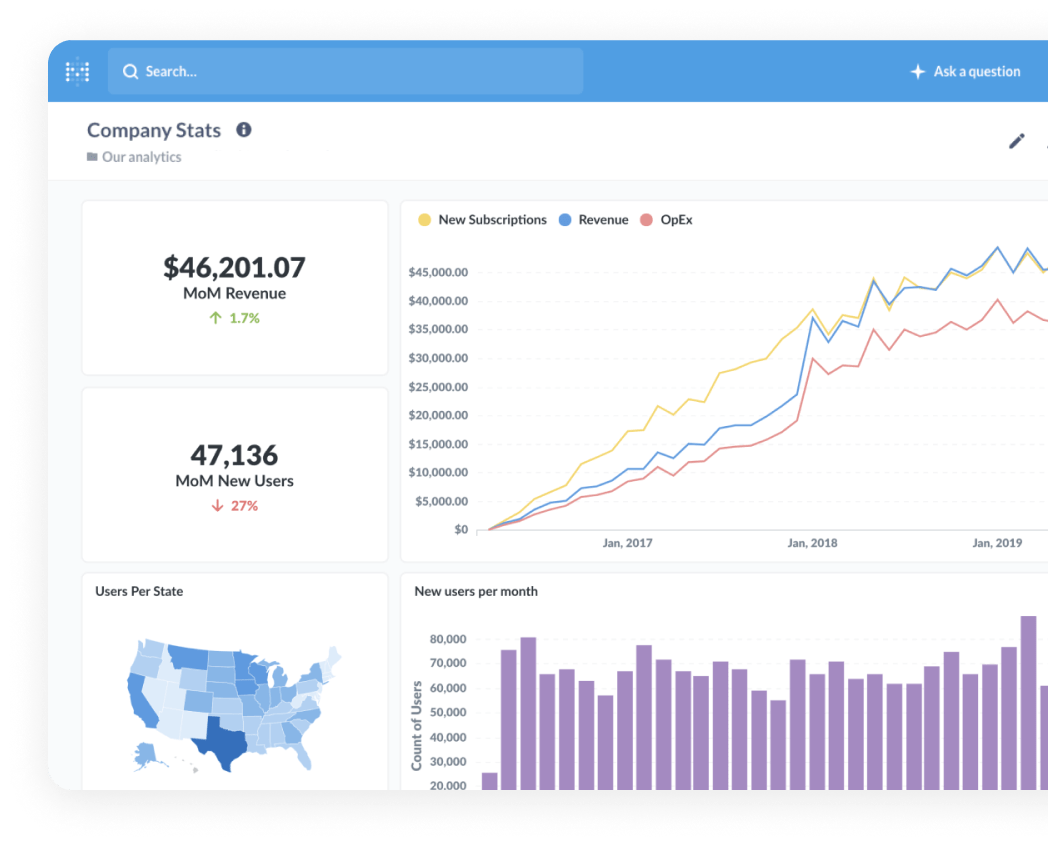
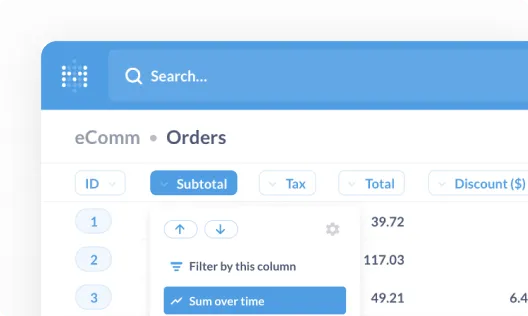
Get everyone on the same page by collecting your most important metrics into a single view.
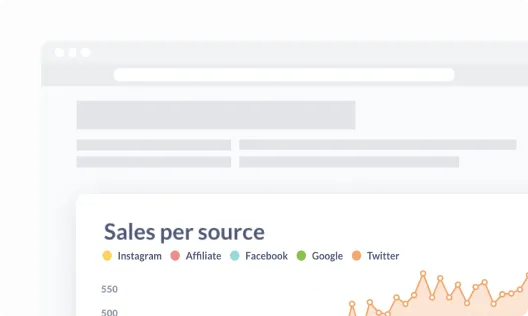
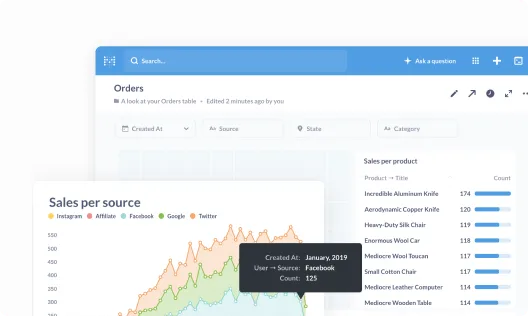
Take your data wherever it needs to go by embedding it in your internal wikis, websites, and content.
Empower your team to measure their own progress and explore new paths to achieve their goals.
Every team is different, but sometimes it helps to start with some examples. Here are our top 8 Sales Teams metrics to start tracking on your dashboards.
Visualize how long it takes to move from first contact to closed deal in your sales dashboard. This is a key metric in any sales reporting dashboard or sales analytics dashboard.
Use your sales team dashboard to track how much pipeline each rep, campaign, or channel is adding. Perfect for sales metrics dashboards in Metabase.
Measure sales effectiveness directly in your Metabase dashboard template with win rate KPIs. Ideal for tracking team performance across sales dashboards.
Add this to your dashboard sales overview to monitor deal value trends. Great for forecasting and understanding high-impact deals in your sales dashboard.
Include CLV in your sales reporting dashboard to measure long-term customer impact. This is especially useful when building a sales analytics dashboard.
Understand drop-offs between sales stages using your sales metrics dashboard. This helps identify friction points directly in your Metabase dashboard examples.
Show how efficiently your sales pipeline is moving. Add this to any salesman dashboard or sales dashboard template in Metabase.
Track what percent of first meetings convert into wins—critical for SDRs and AEs using a sales team dashboard.

That's right, no sales calls necessary—just sign up, and get running in under 5 minutes.

We connect to the most popular production databases and data warehouses.
Invite your team and start building dashboards—no SQL required.