




What is employee turnover rate, and how do you measure it in Metabase?
Employee turnover rate is departures divided by average headcount per period, usually annualized. It's the retention headline — but the headline is the least useful part; the splits (voluntary vs. involuntary, regrettable vs. not, first-year vs. tenured) carry all the meaning. Measure it in Metabase from HRIS data synced from BambooHR, Workday, or an ATS-adjacent system like Ashby.
departures ÷ average headcount, annualized. Report voluntary
and involuntary on separate lines, flag regrettable exits at offboarding,
and segment by tenure — first-year turnover is a hiring problem wearing a
retention costume. You need headcount snapshots: current-state HRIS syncs
can't rebuild history.
What does an employee turnover rate chart look like in Metabase?
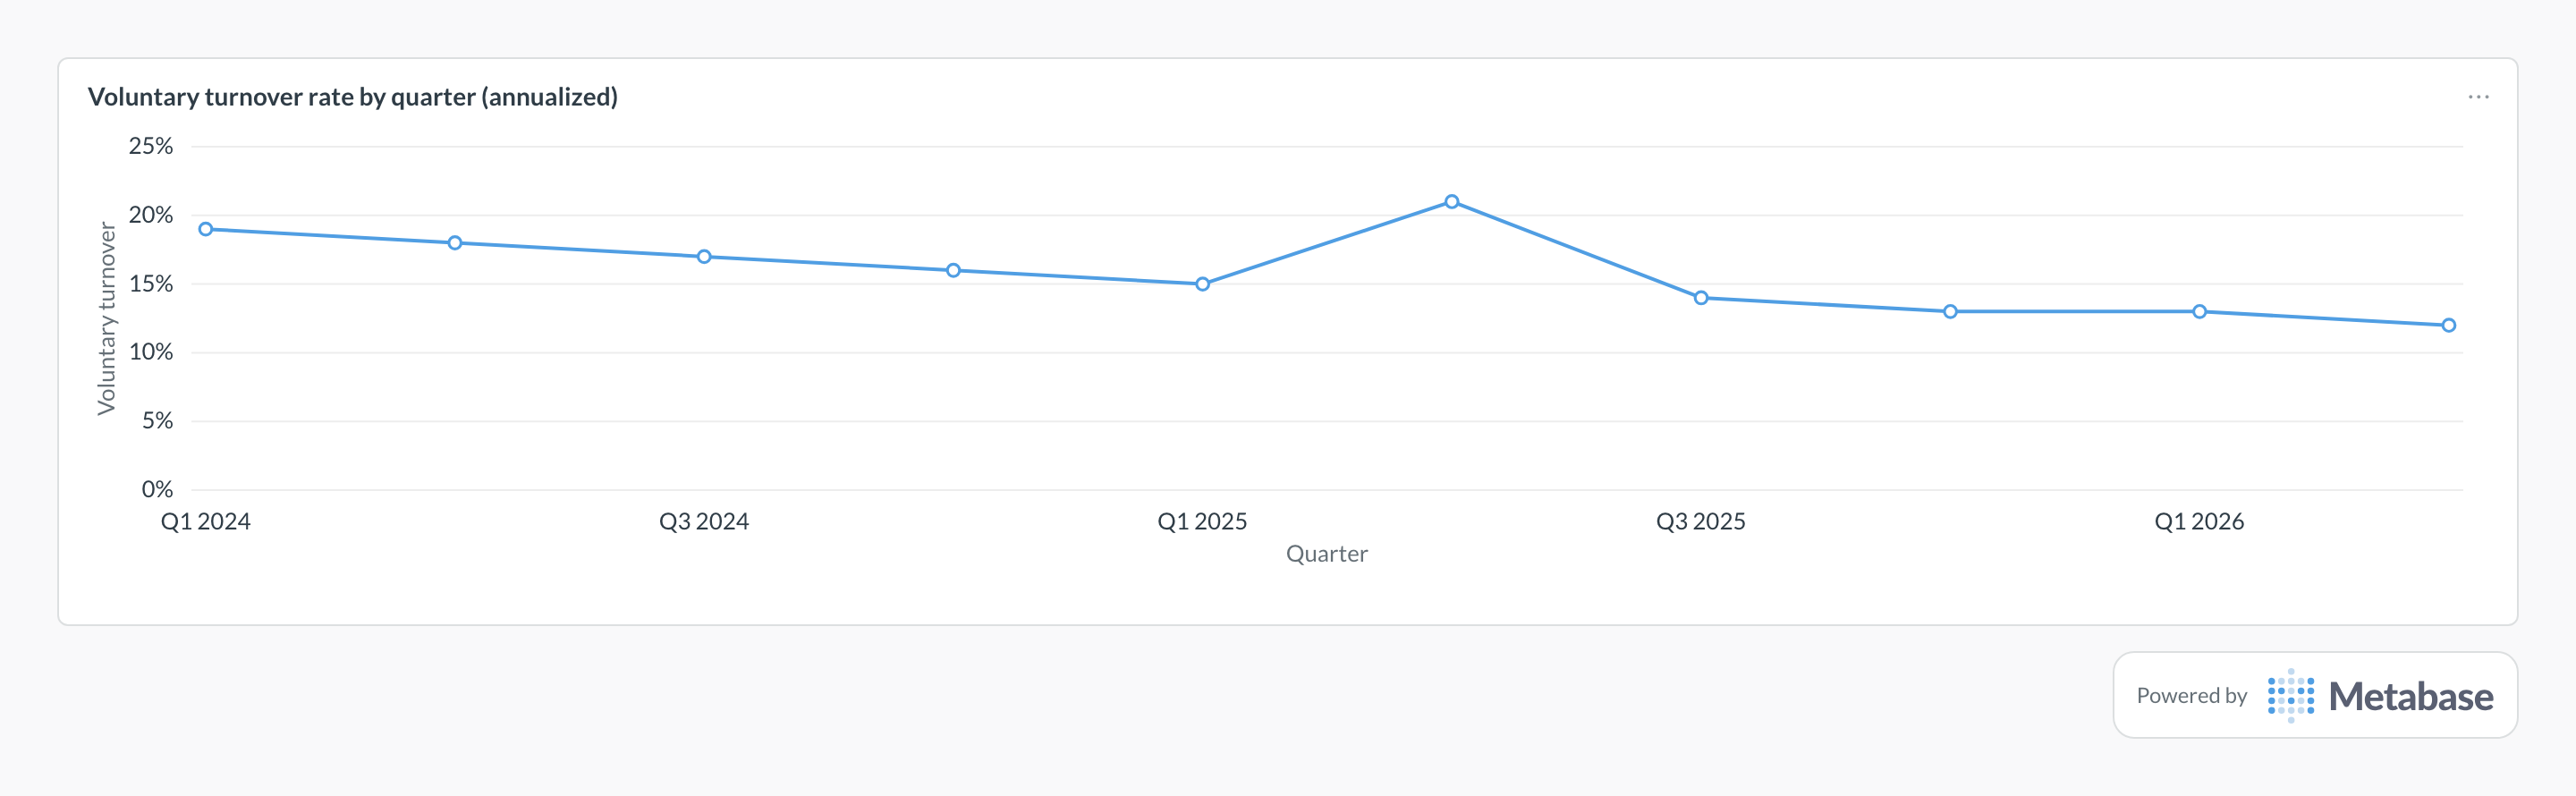
Plot annualized voluntary turnover by quarter — the voluntary line is the one management can act on. The gradual decline is retention work paying off, while a spike like Q2 2025's, landing right after a compensation cycle, points at pay-band gaps rather than a slow cultural slide.
What turnover rate measures
It measures how fast the organization is losing people, normalized for size so a ten-person team and a thousand-person company can be read on the same scale. Annualizing makes periods comparable: 5% in a quarter is 20% annualized, which is the number leadership and benchmarks speak in.
The blended rate hides more than it shows. Voluntary and involuntary turnover have opposite root causes — one is people choosing to leave, the other is the company choosing — so they belong on separate lines. Within voluntary, regrettable attrition is the signal that matters: the departures you'd have paid to prevent. And segmentation does the diagnostic work — by team (a single manager can drive a company-wide uptick), by level, and by tenure, where a heavy first-year bucket points at hiring and onboarding rather than retention. Benchmark ranges vary so much by industry that the trend against your own history beats any external level.
What data does it need?
-
A
headcount_snapshotstable — headcount by date (and ideally by team and level), written on a schedule. This is the piece HRIS syncs don't give you: they mirror current state, and history can't be reconstructed later. Start the snapshot job before you need the metric. -
A departures model with
termination_date,termination_type(voluntary/involuntary), anis_regrettableflag captured at offboarding, andhire_datefor tenure math. - Team, department, and level attributes on both tables, so rates segment cleanly.
- HRIS or payroll data synced to your warehouse via Airbyte, Fivetran, or dlt.
SQL patterns
WITH quarterly_headcount AS (
  SELECT
    date_trunc('quarter', snapshot_date) AS quarter,
    AVG(headcount) AS avg_headcount
  FROM headcount_snapshots
  GROUP BY 1
),
quarterly_departures AS (
  SELECT
    date_trunc('quarter', termination_date) AS quarter,
    COUNT(*) FILTER (WHERE termination_type = 'voluntary')
      AS voluntary,
    COUNT(*) FILTER (WHERE termination_type = 'involuntary')
      AS involuntary
  FROM departures
  GROUP BY 1
)
SELECT
  h.quarter,
  ROUND(h.avg_headcount)  AS avg_headcount,
  d.voluntary,
  d.involuntary,
  ROUND(
    400.0 * d.voluntary / NULLIF(h.avg_headcount, 0), 1
  ) AS voluntary_annualized_pct,
  ROUND(
    400.0 * (d.voluntary + d.involuntary)
    / NULLIF(h.avg_headcount, 0), 1
  ) AS total_annualized_pct
FROM quarterly_headcount h
JOIN quarterly_departures d USING (quarter)
ORDER BY h.quarter;SELECT
CASE
WHEN termination_date - hire_date < 365 THEN '< 1 year'
WHEN termination_date - hire_date < 730 THEN '1-2 years'
WHEN termination_date - hire_date < 1460 THEN '2-4 years'
ELSE '4+ years'
END AS tenure_bucket,
COUNT(*) AS departures,
COUNT(*) FILTER (WHERE termination_type = 'voluntary')
AS voluntary,
COUNT(*) FILTER (WHERE is_regrettable) AS regrettable
FROM departures
WHERE termination_date >= CURRENT_DATE - INTERVAL '12 months'
GROUP BY 1
ORDER BY MIN(termination_date - hire_date);Pitfalls
Where this metric applies
- BambooHR + Metabase — employee records with termination dates and types
- Workday + Metabase — worker history and termination events
- Ashby + Metabase — hire dates joined to downstream retention
- Greenhouse + Metabase — hiring cohorts for first-year turnover analysis
Related
Metrics
Dashboards
FAQ
How do you calculate employee turnover rate?
What's a good employee turnover rate?
What is regrettable attrition?
is_regrettable flag set at offboarding (usually by the manager or HRBP), so make that a required exit-process field. Pair it with time to fill to price what each regrettable exit costs in backfill time.Why does first-year turnover deserve its own line?
How do you track turnover in Metabase?
headcount_snapshots), model departures with type and regrettable flags, and build the quarterly view from those two tables.