




What is cost per hire, and how do you measure it in Metabase?
Cost per hire is total recruiting spend — internal plus external — divided by hires in the period. It's the unit economics of recruiting: the number that turns "we spent a lot on agencies" into a per-hire figure you can compare across quarters, sources, and role families. Measure it in Metabase from ATS data synced from Greenhouse, Ashby, or BambooHR, joined to recruiting costs from your accounting system.
(internal + external recruiting costs) ÷ hires, the SHRM
formula. Define the numerator once and hold it; segment by source and role
family, where 10x spreads live; and pair it with 90-day retention so the
cheap source that can't keep its hires doesn't win the budget.
What does a cost per hire chart look like in Metabase?
Track blended cost per hire by quarter as a line and read the trend, not any single quarter. The gradual decline reflects a growing referral and inbound mix, while a spike like Q1 2025's usually traces to a few agency-sourced executive searches landing in one quarter — a mix shift, not a broken process.
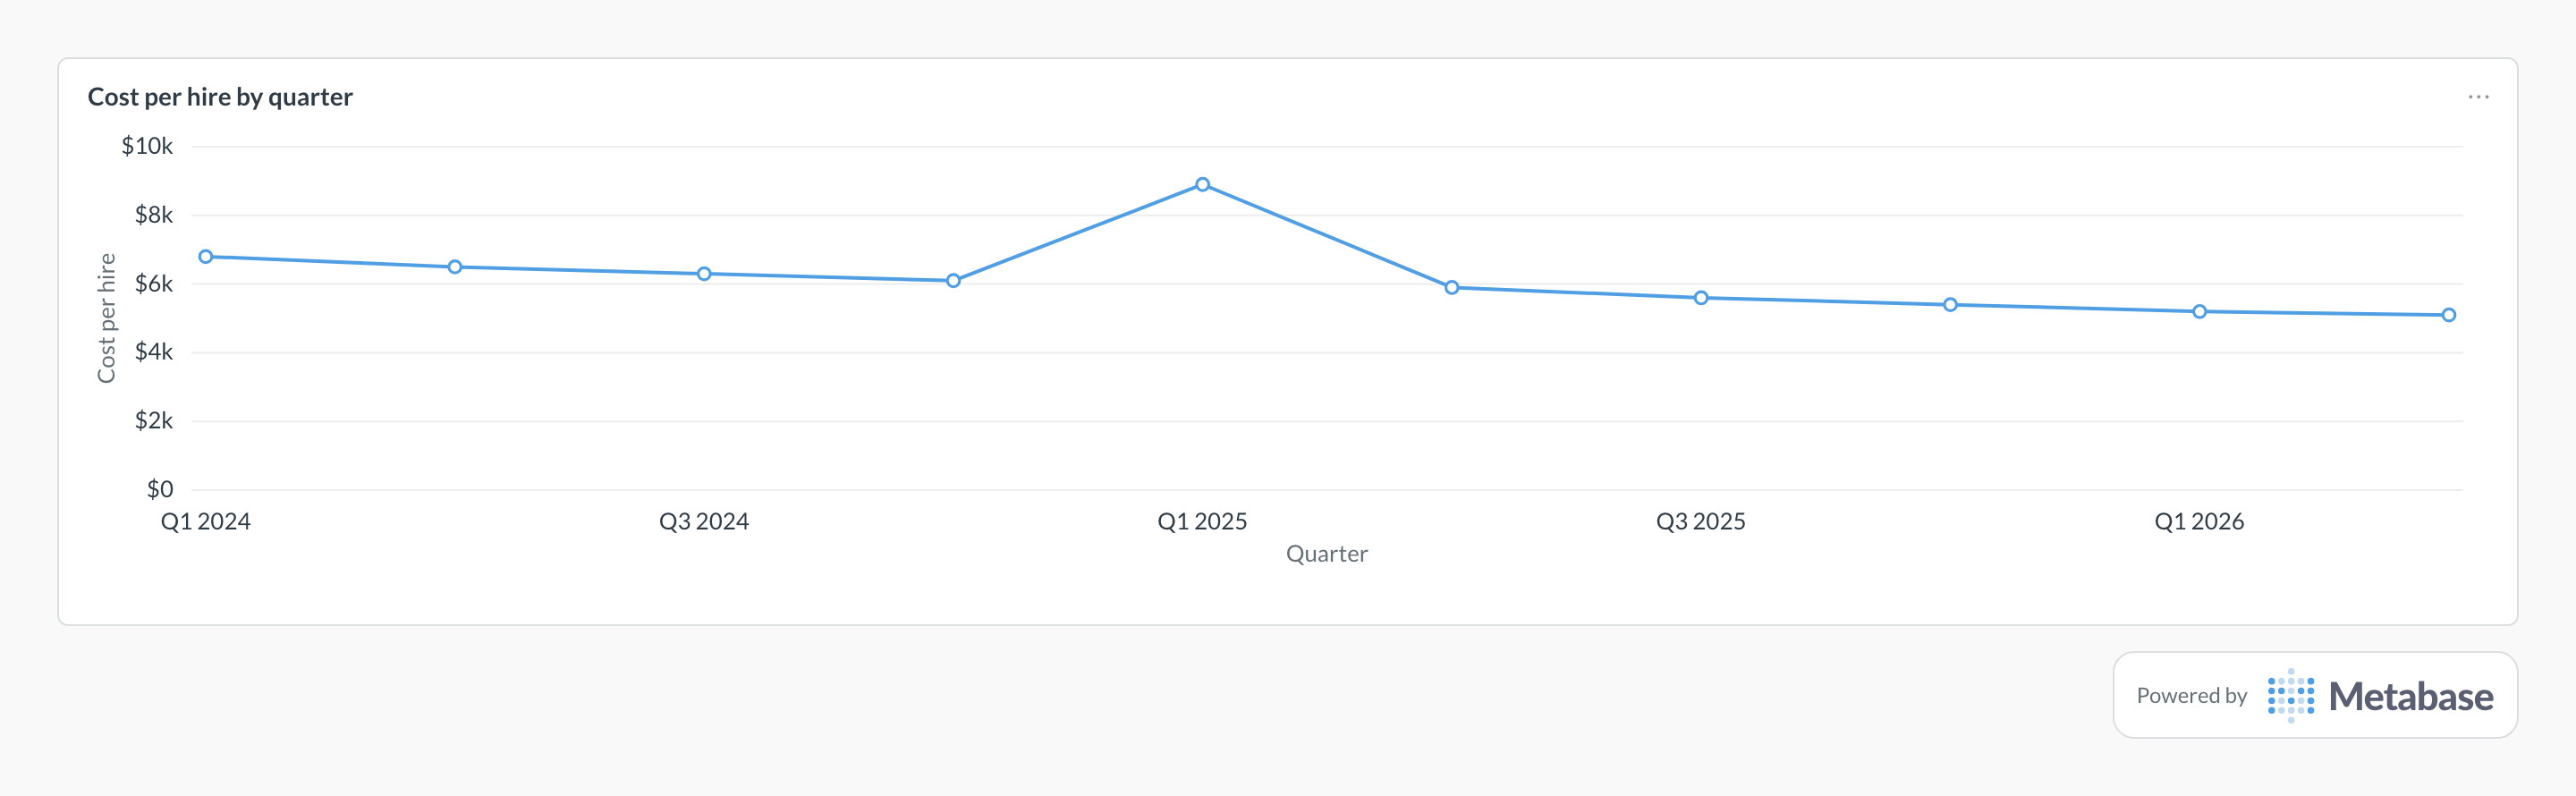
What cost per hire measures
It measures recruiting efficiency in currency. The SHRM-standard numerator has two halves: external costs — agency and search fees, job-board postings, background checks, assessment and sourcing tools — and internal costs — the share of recruiter and coordinator compensation attributable to hiring, plus referral bonuses. What you include is less important than including the same things every quarter; the metric's value is in the trend and the comparisons, and both die when scope drifts.
The blended average is a board slide. The working views are segmented: by source, where agency vs. referral vs. inbound routinely differ 10x; by role family and level, so an executive-heavy quarter doesn't read as inflation; and against a quality signal like 90-day retention, so optimizing cost never quietly optimizes for bad hires. Read it alongside time to hire — speed and cost are the trade-off pair.
What data does it need?
-
A hires model from your ATS with
start_date,source(agency, referral, inbound, sourced), role family, and level — synced to your warehouse via Airbyte, Fivetran, or dlt. -
A
recruiting_coststable withamount,category(agency fees, job boards, tooling, recruiter comp, referral bonuses), andincurred_at— from your accounting export or a deliberately maintained sheet. - Per-hire cost allocations (direct fees tied to the hire; shared costs spread by convention) for the by-source view.
- An early quality signal per hire — 90-day retention is the simplest — so cost never gets optimized in a vacuum.
SQL patterns
WITH quarterly_costs AS (
  SELECT
    date_trunc('quarter', incurred_at) AS quarter,
    SUM(amount) FILTER (
      WHERE category IN ('agency_fees', 'job_boards', 'tooling')
    ) AS external_costs,
    SUM(amount) FILTER (
      WHERE category IN ('recruiter_comp', 'referral_bonuses')
    ) AS internal_costs
  FROM recruiting_costs
  GROUP BY 1
),
quarterly_hires AS (
  SELECT
    date_trunc('quarter', start_date) AS quarter,
    COUNT(*) AS hires
  FROM modeled_hires
  GROUP BY 1
)
SELECT
  c.quarter,
  h.hires,
  c.external_costs,
  c.internal_costs,
  ROUND(
    (c.external_costs + c.internal_costs)
    / NULLIF(h.hires, 0), 0
  ) AS cost_per_hire
FROM quarterly_costs c
JOIN quarterly_hires h USING (quarter)
ORDER BY c.quarter;SELECT
h.source,
COUNT(*) AS hires,
ROUND(
SUM(a.allocated_cost) / NULLIF(COUNT(*), 0), 0
) AS cost_per_hire,
ROUND(
100.0 * COUNT(*) FILTER (WHERE h.retained_90d)
/ NULLIF(COUNT(*), 0), 1
) AS retained_90d_pct
FROM modeled_hires h
LEFT JOIN hire_cost_allocations a ON a.hire_id = h.id
WHERE h.start_date >= CURRENT_DATE - INTERVAL '12 months'
AND h.start_date < CURRENT_DATE - INTERVAL '90 days'
GROUP BY 1
ORDER BY cost_per_hire DESC;Pitfalls
Where this metric applies
- Greenhouse + Metabase — hires with source and job attributes
- Ashby + Metabase — hire events and source attribution
- BambooHR + Metabase — start dates and early retention outcomes
- Workday + Metabase — hires joined to finance cost centers