


‧
6 min read
10 handy Metabase features you may not know about
The Metabase Team
‧ 6 min read

Share this article
Metabase’s interface tries to stay out of your way to help bring your data to the forefront. This laid-back approach means that sometimes features can take time to discover, so we put together an updated list of some features you may not be taking advantage of yet.
Note: We’ve updated this list from 7 to 10 to include newer features and updates.
1. Alerts: get notified when a metric hits a certain number
Some people miss the menu in the bottom right corner of a question:
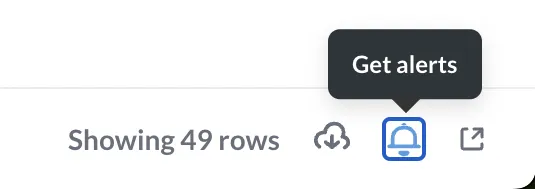
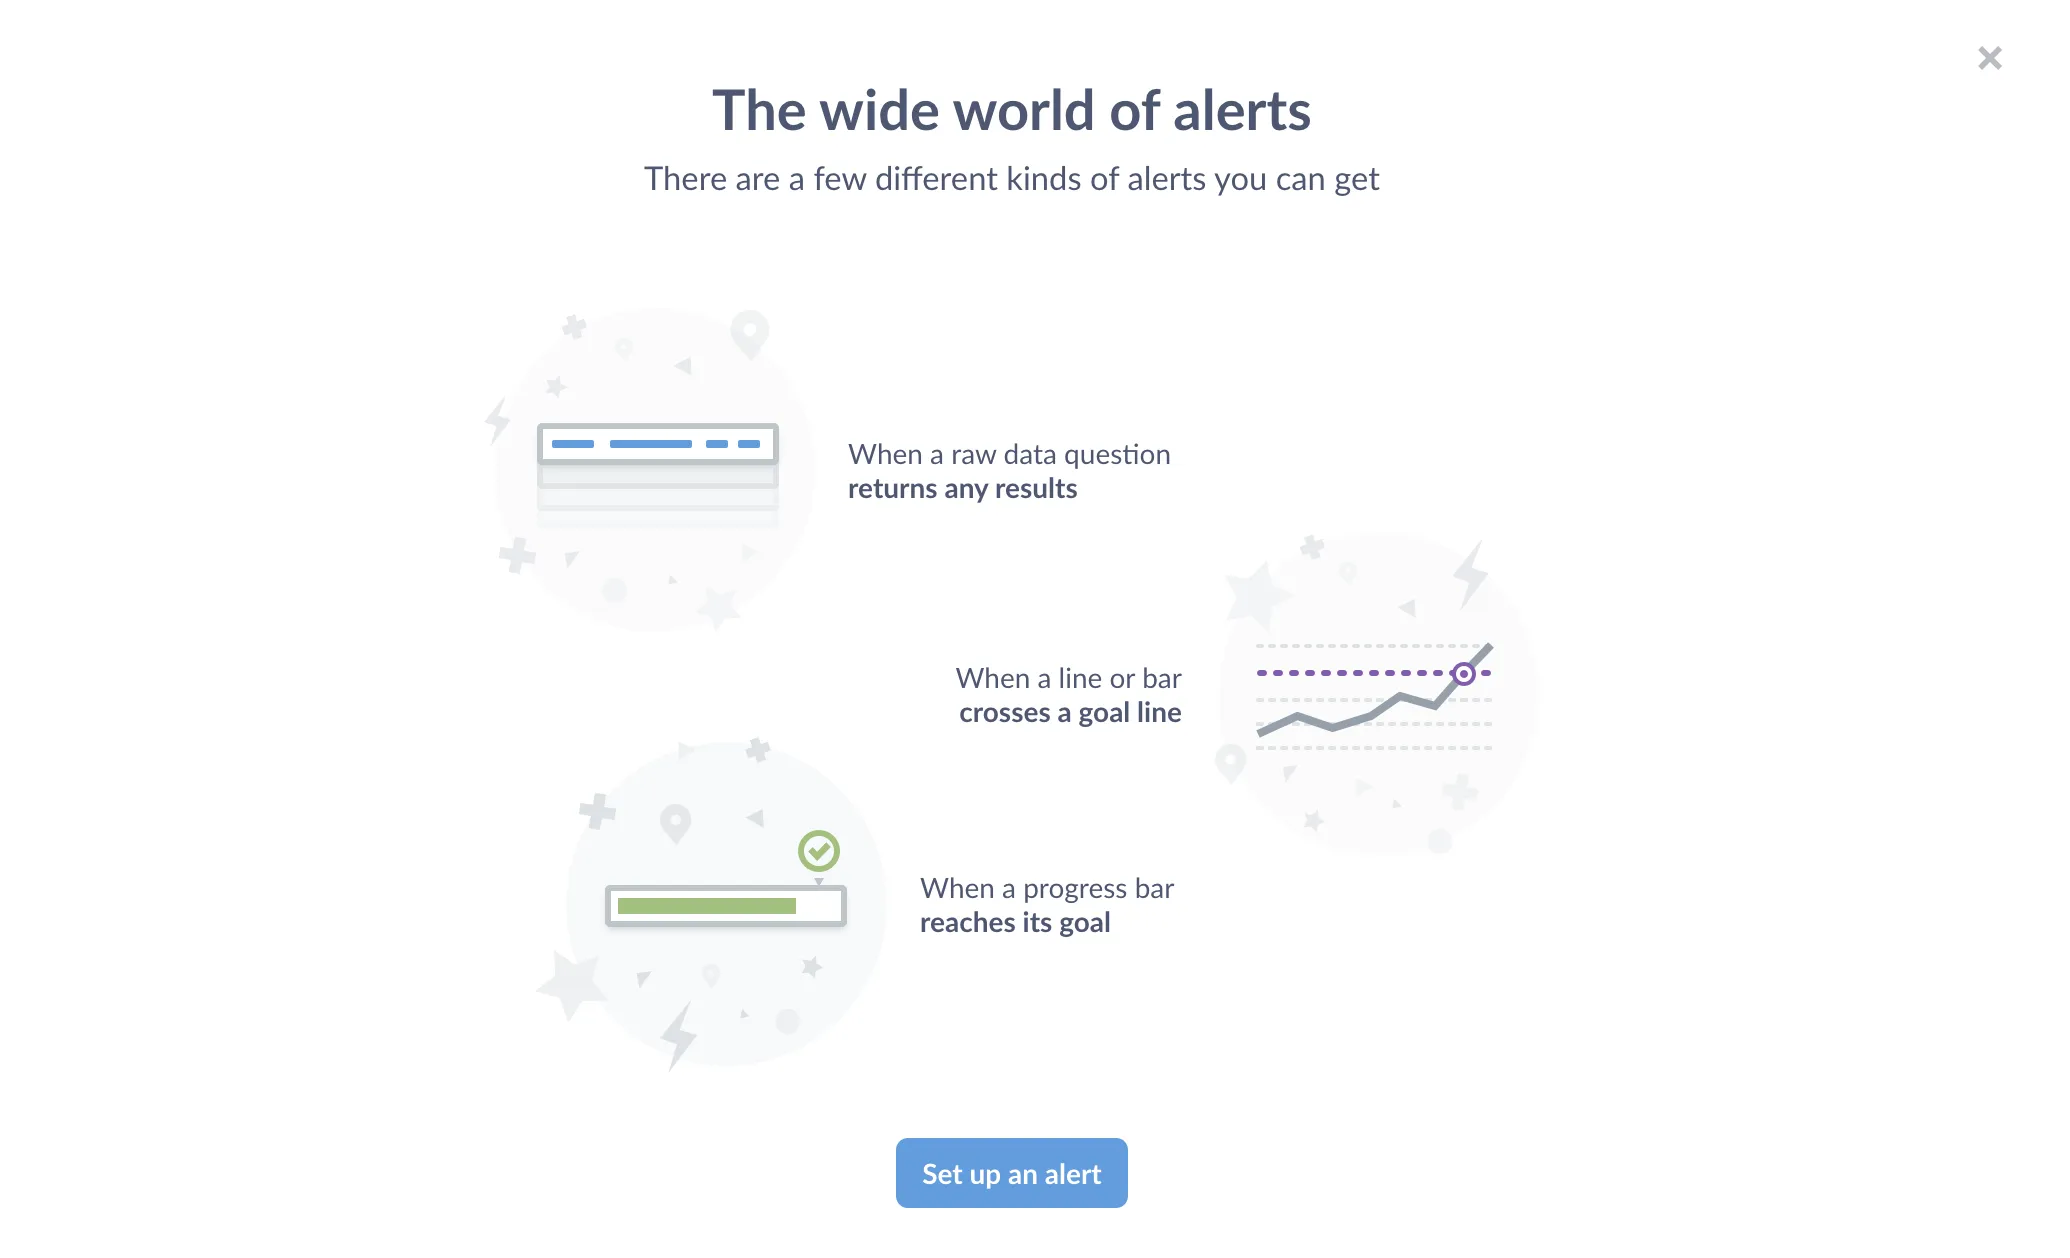
They don’t click on the bell, so they never figure out that you can set up a question to send you an email or Slack message based on:
- When a time series crosses a goal line.
- When a progress bar reaches (or goes below) its goal.
- When a question returns a result.
You can schedule the question to run hourly, daily, or weekly. If the results meet your criteria, Metabase will send you an email or Slack message letting you know.
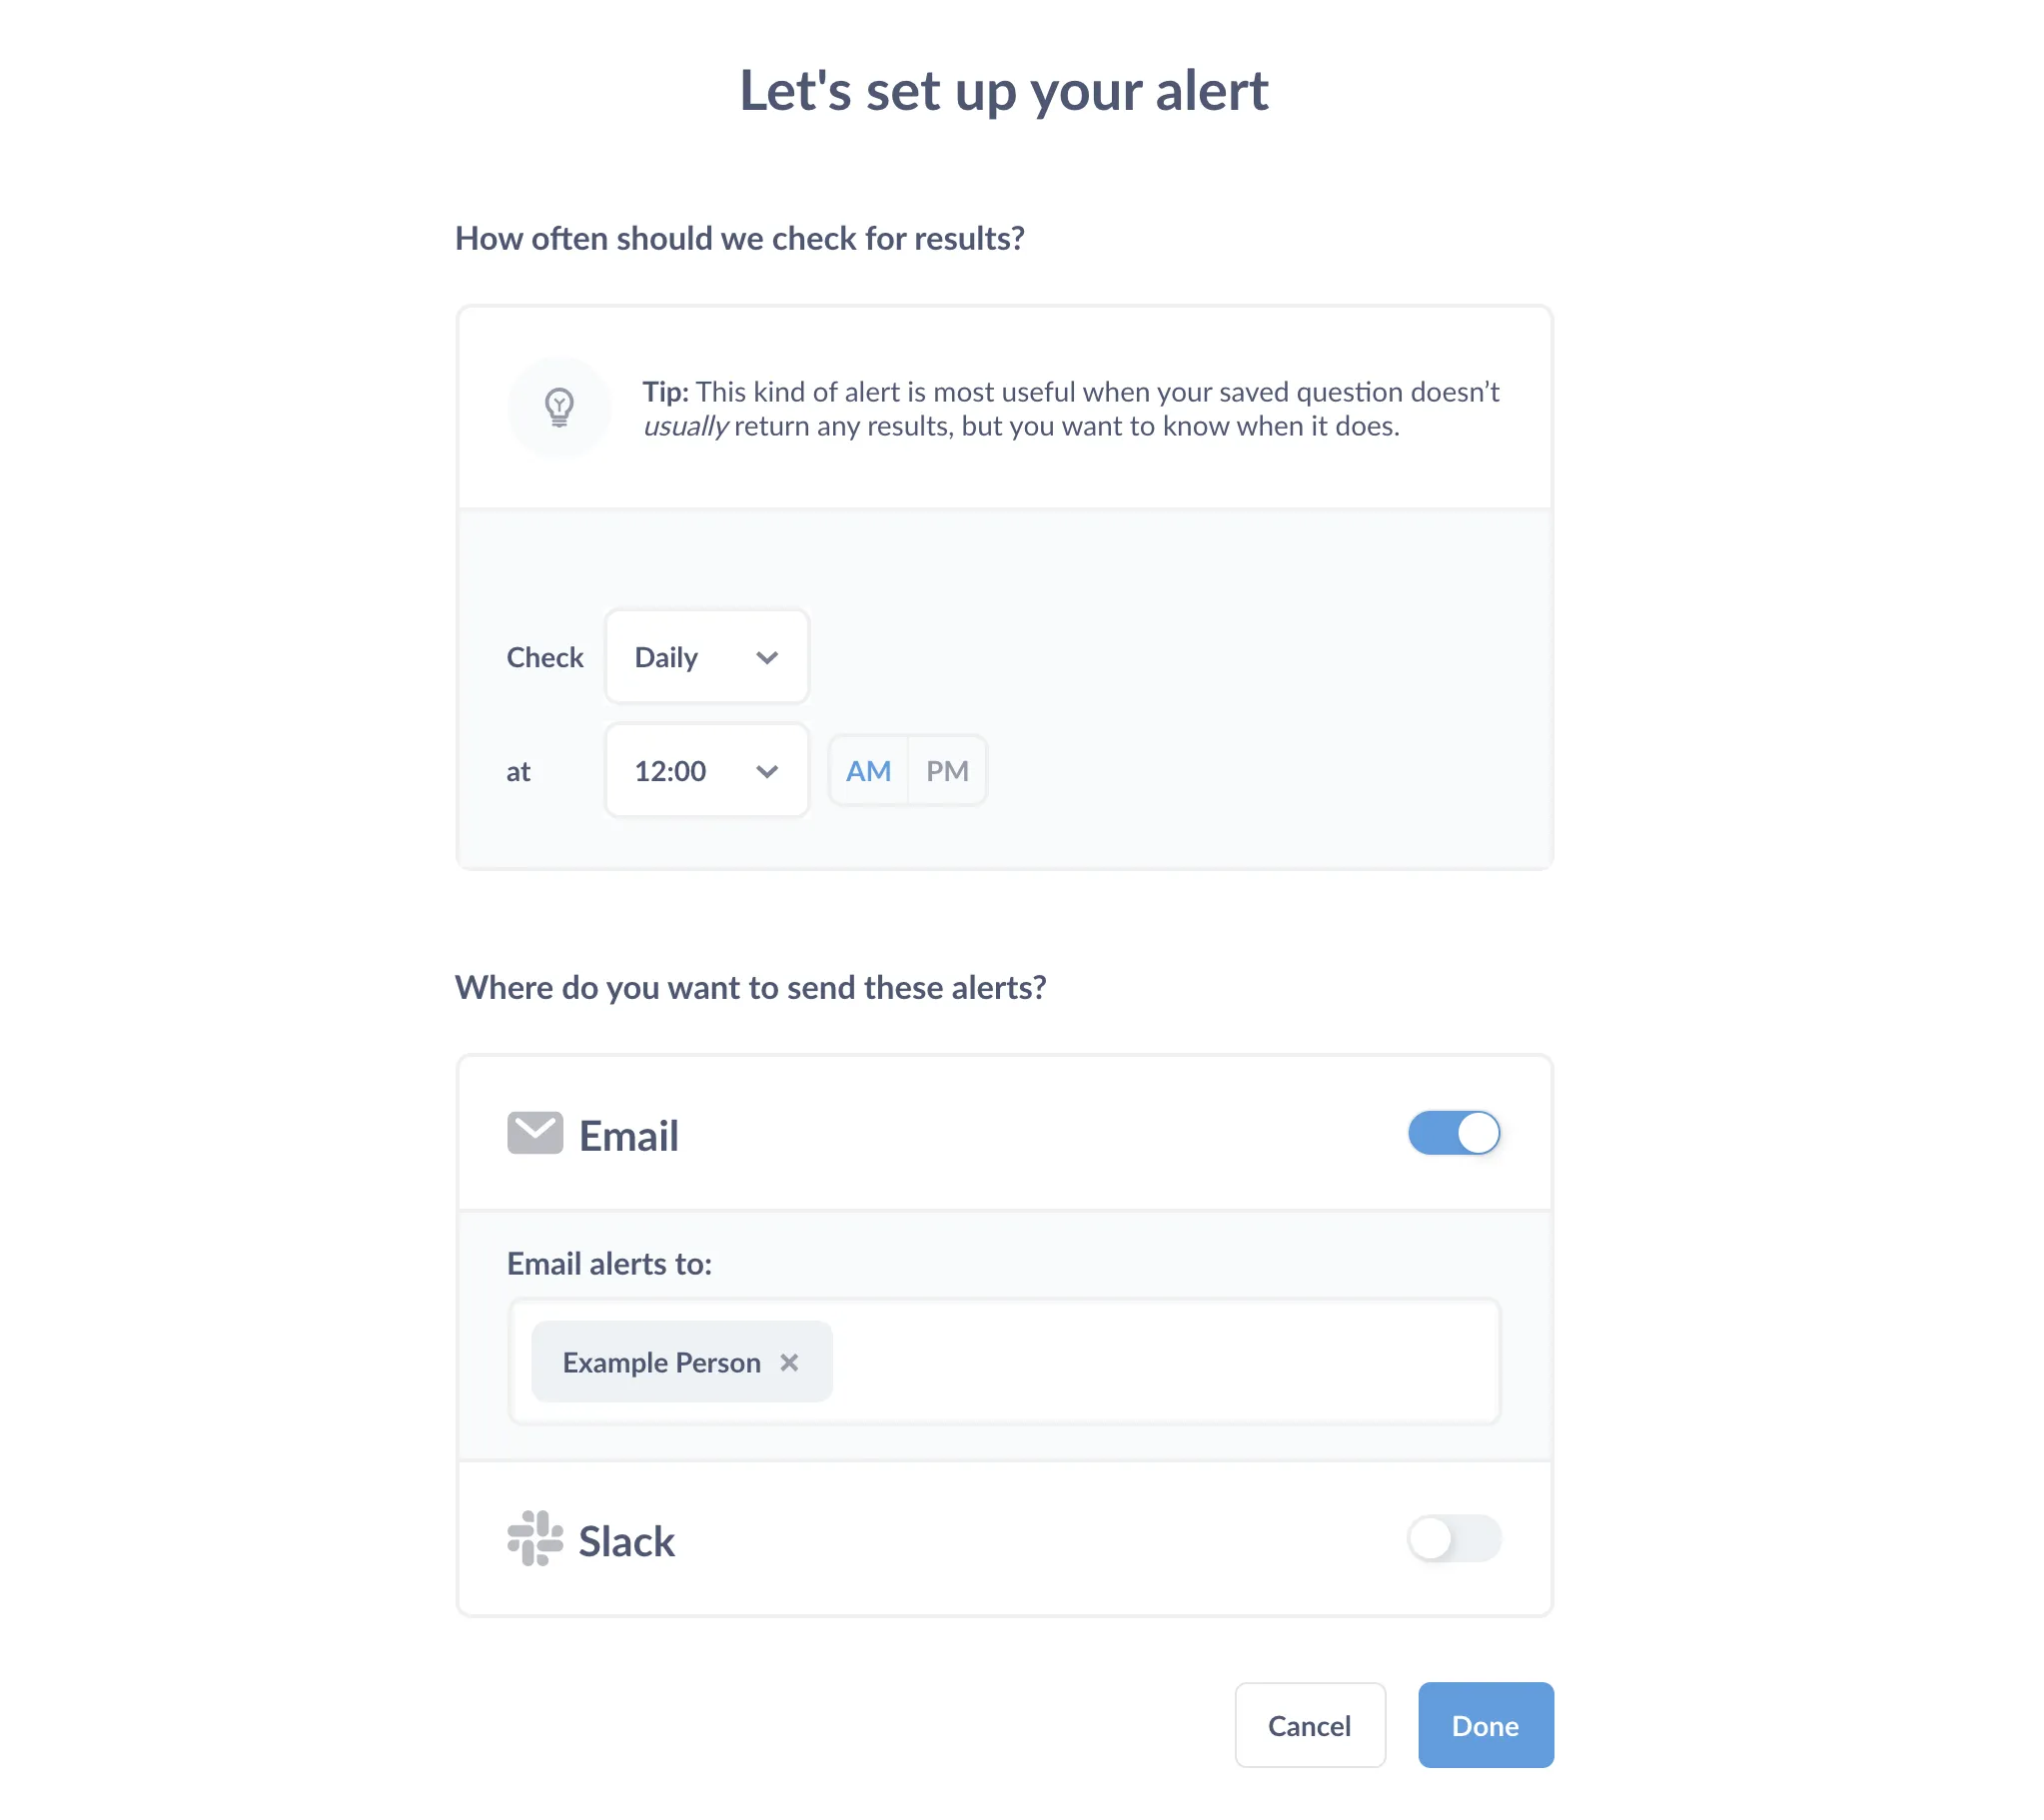
Once you’ve set up your alerts, you can focus your attention elsewhere until your data needs your attention again.
To learn more, check out Getting alerts about questions.
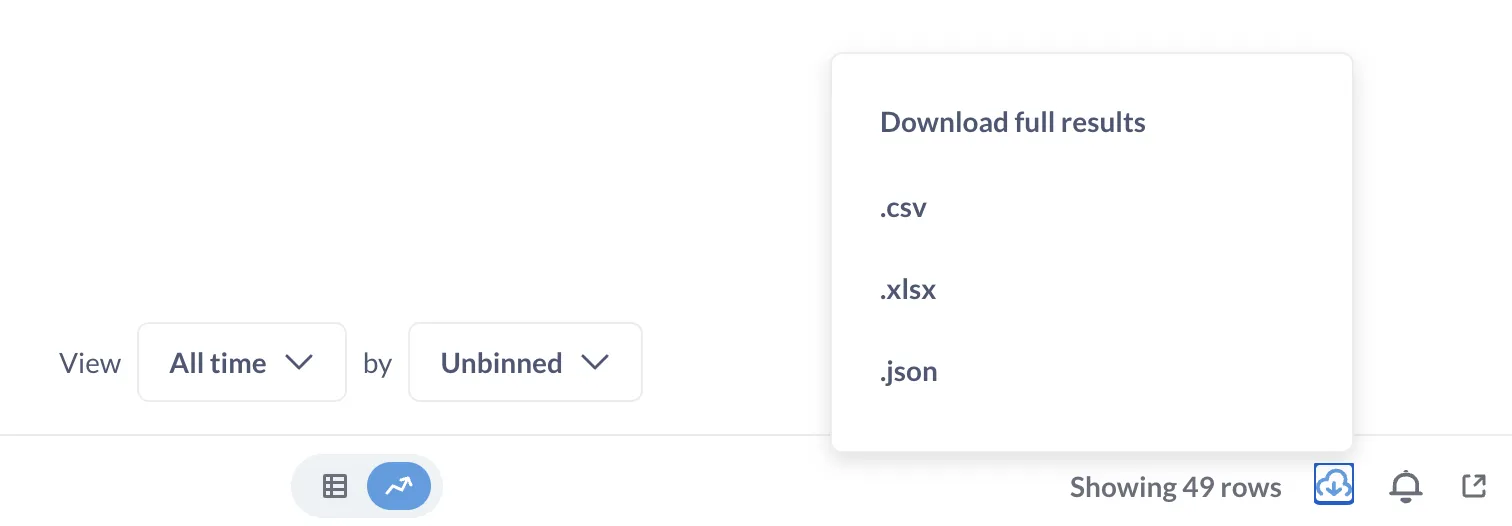
2. Download results as CSV, Excel, JSON, PDF, or PNG
While we’re still in the bottom-right menu of a question, another often-overlooked feature is the ability to download the results of a question.
If you’d prefer to share the results as a question in Metabase, check out our Guide to sharing data.
3. Field Filters: create smart filter widgets
Field Filters are a special kind of variable you can include in a SQL query that allows Metabase to create filters that “know” about the data in the column. What this means in practice is that you can do things like create a filter with a date picker, or a dropdown menu of pre-populated options. They take a bit to get the hang of, which is why we wrote a Learn article on Field Filters, but experienced users rely on them all the time.
4. Customize what happens when people click on a chart
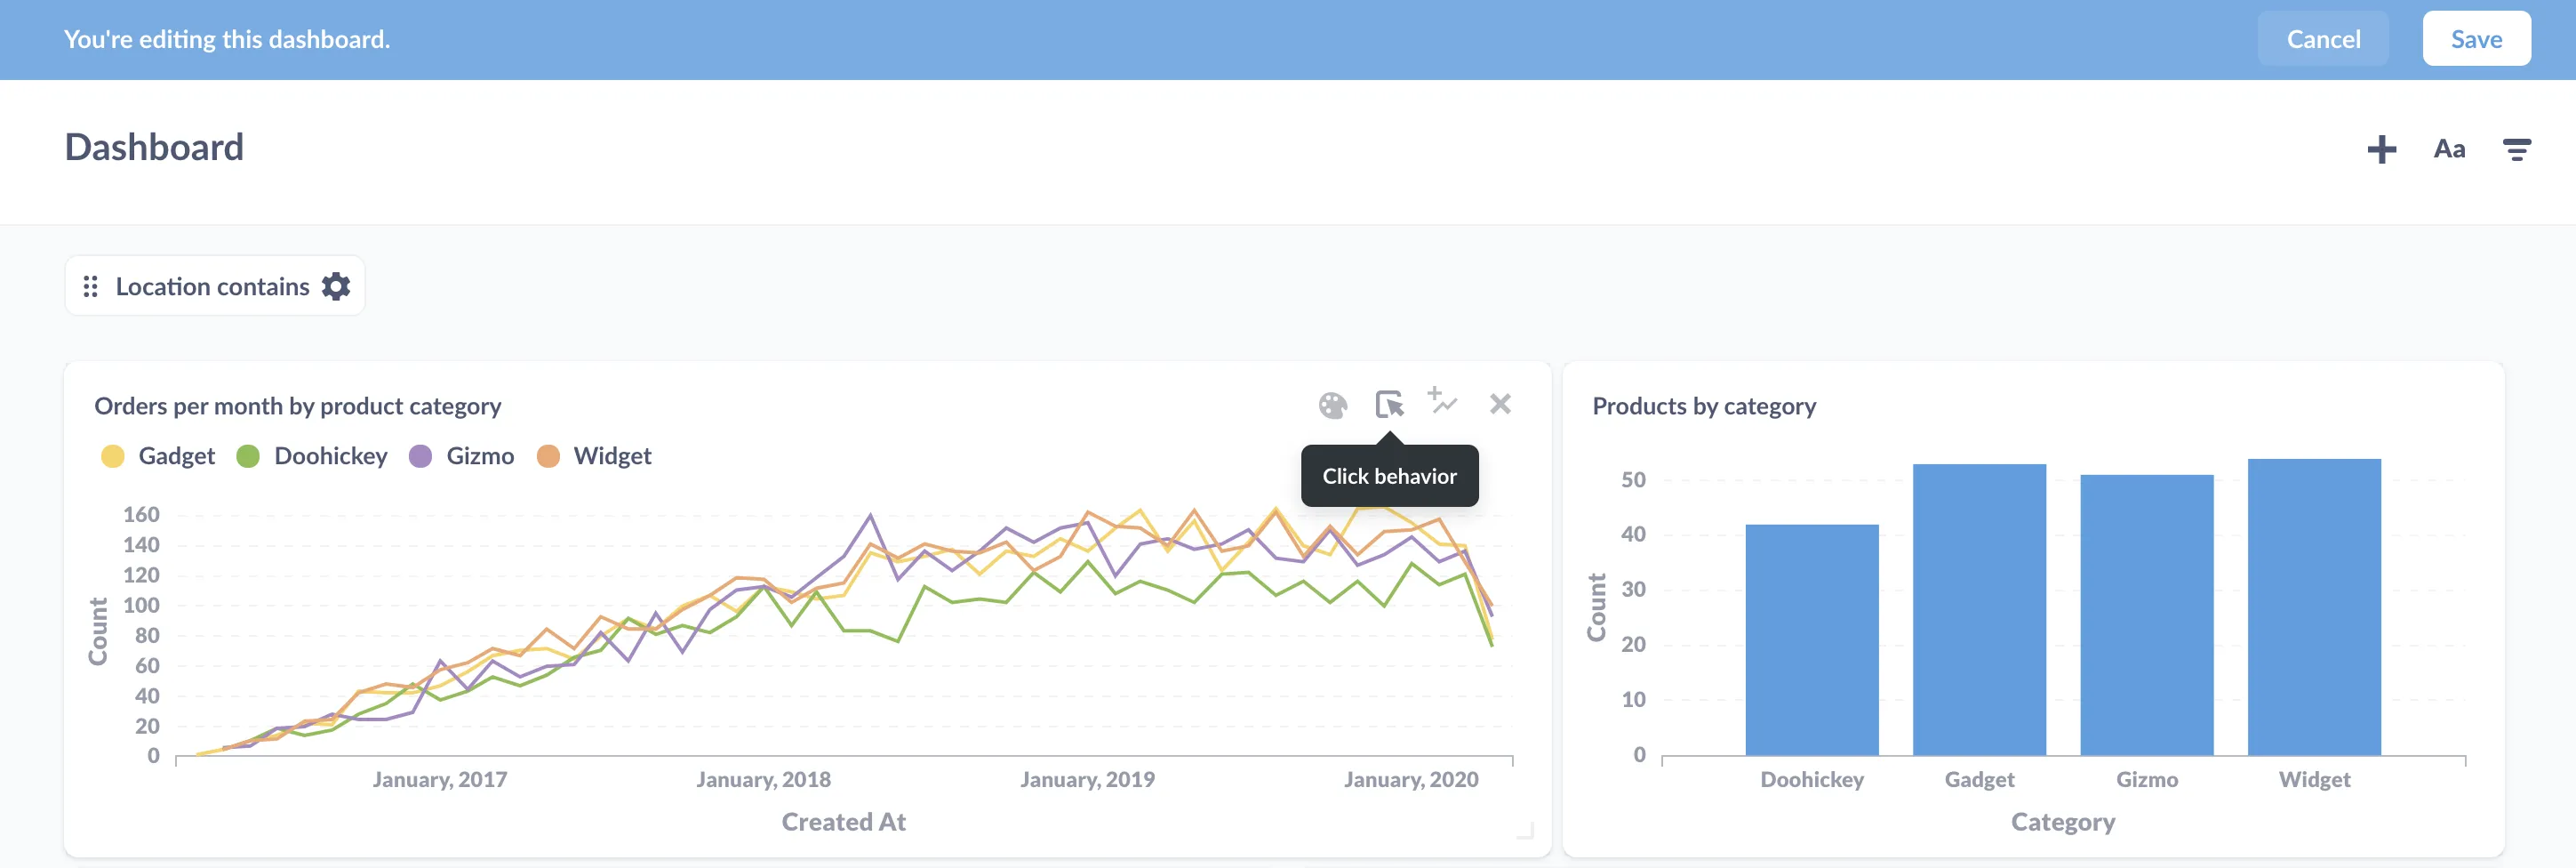
You can customize the on-click behavior of a question when you add it to a dashboard. Here are your options:
- Open the Metabase action menu.
- Custom destinations: choose what happens when people click on a chart.
- Cross-filtering: using a chart to update a filter.
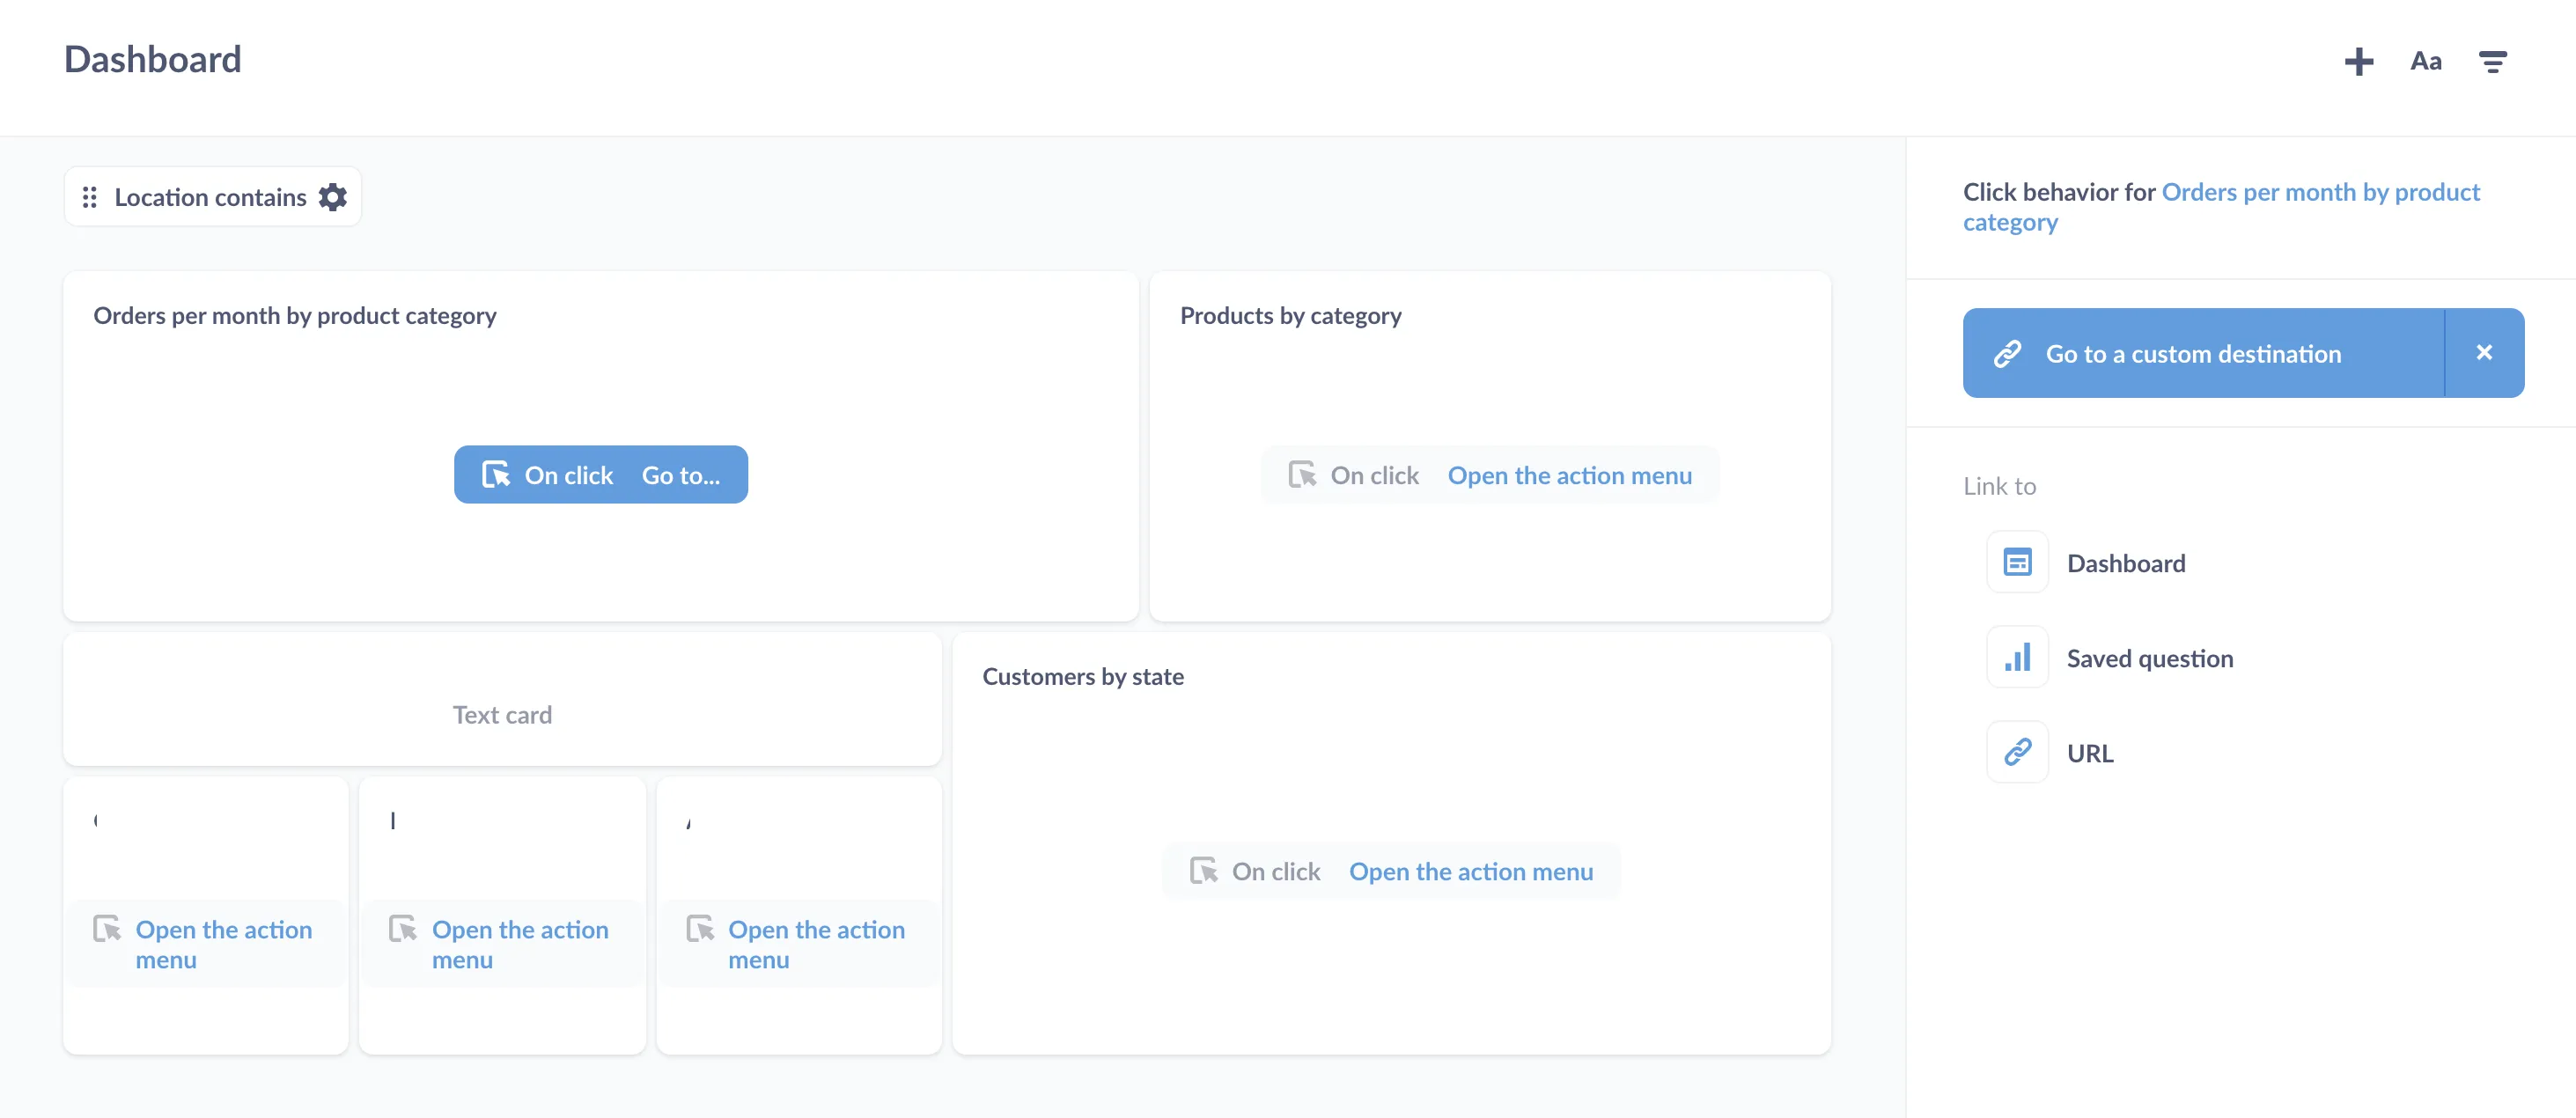
You can use values from the chart to parameterize the links. To learn more, check out the articles listed above or see our docs to learn about Interactive dashboards.
5. Add time series from different databases to a single dashboard card
If you click the Add Series option directly to the right of the on-click behavior option we just mentioned, you can layer series from any of your saved questions right onto your dashboard card; no manual joins required.
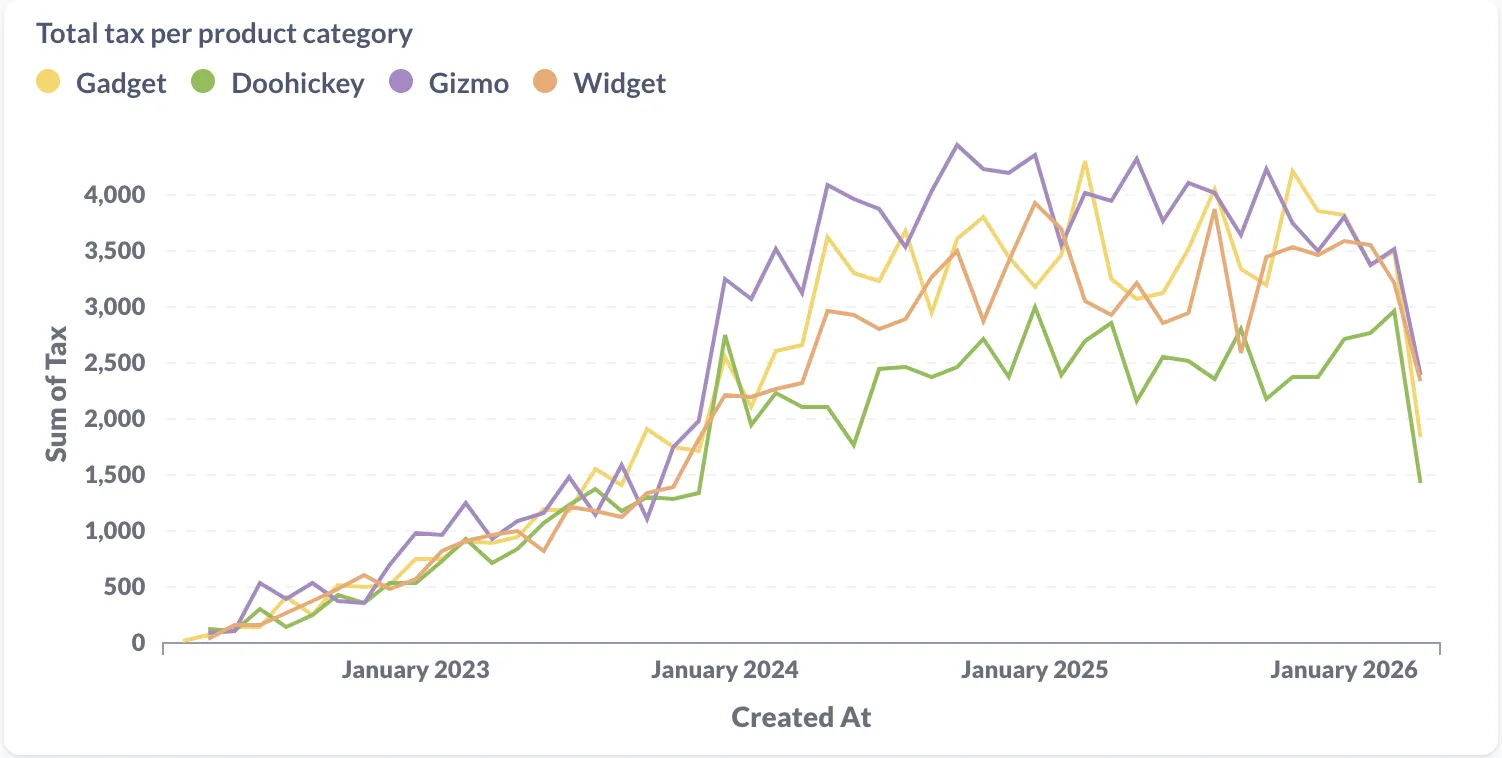
Note that you can only add time series to another time series, like adding the series revenue over time to a card with transactions over time.
See our docs to learn more about Interactive dashboards.
6. Link filters in dashboards
Do you have two dashboard filters that are related? You can link from one filter to another to create hierarchies. For example, set up a State filter that is linked to a City filter. Now when someone selects a specific state in the first filter, it will only show that state’s cities as selectable in the second filter.
To learn more, see our article on Linking filters in a dashboard.
7. Multi-step summarizations in the notebook editor
When using the notebook editor, most people stop at 1) select data, 2) filter it, and 3) summarize it. But you can keep going: adding additional stages of filtering, joining, and summarizing to get the answer you need.
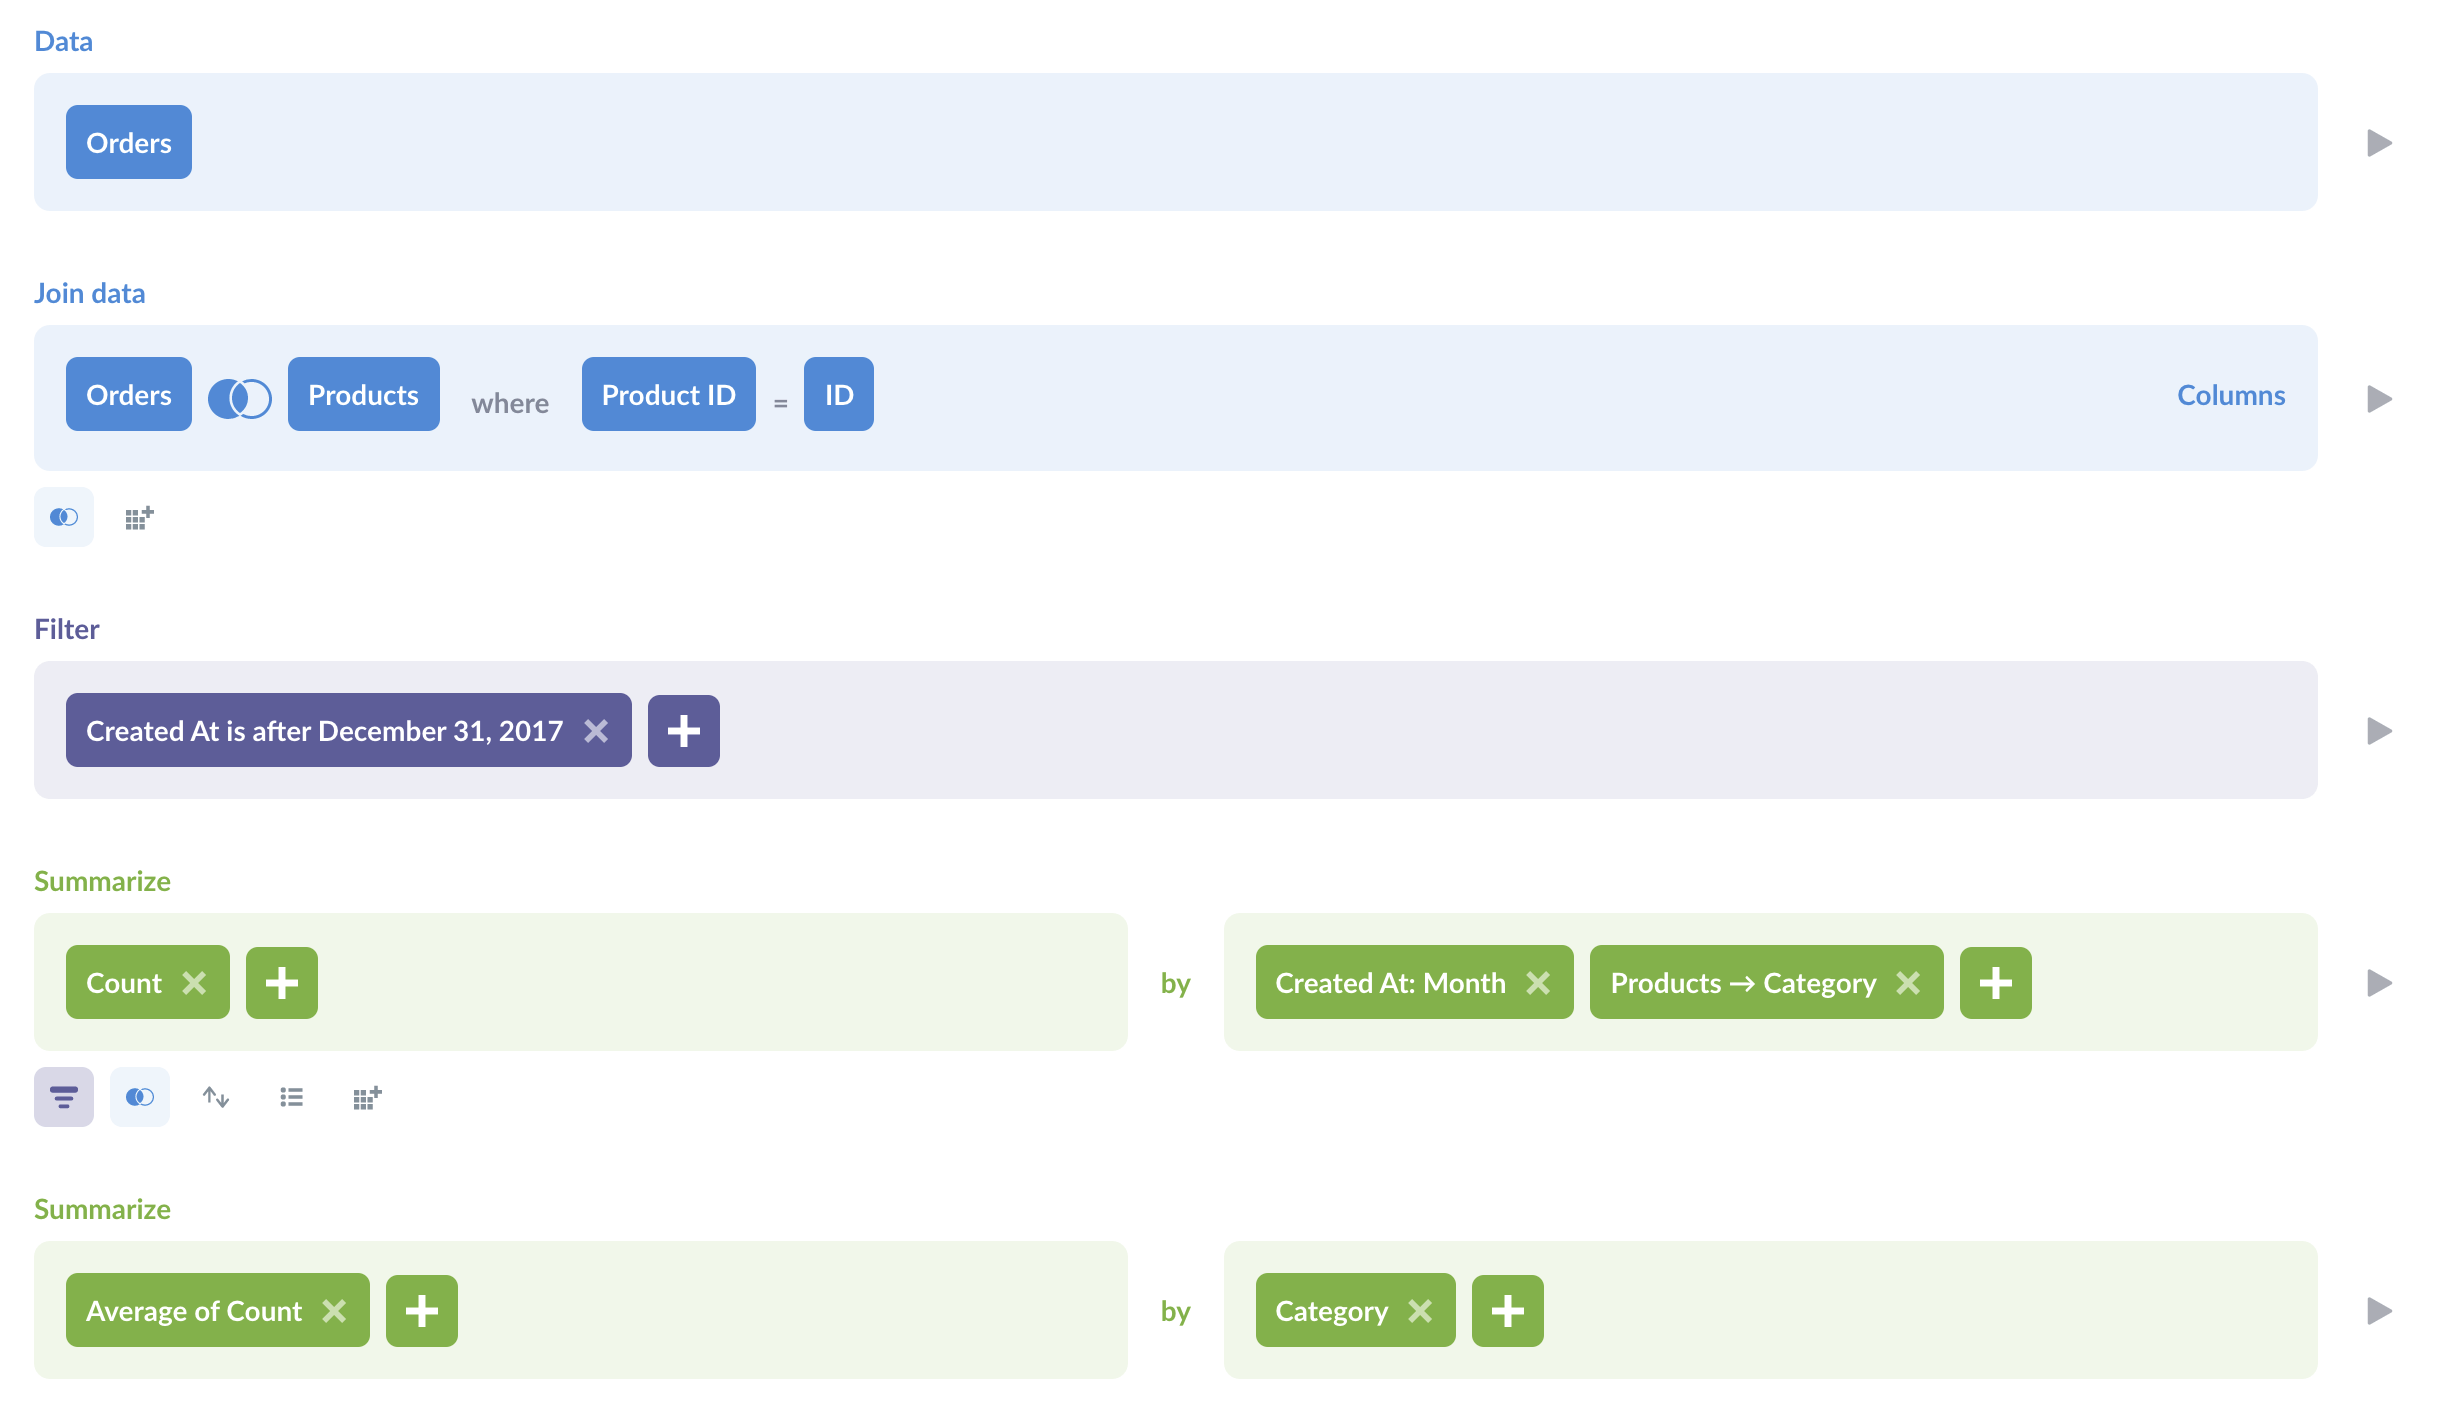
This opens up a lot more possibilities for what you can do with the notebook editor.
For example, you can use the notebook editor to join a question with another saved question to create a ratio: after joining the two questions, just create a custom column where you divide one question’s metric column by the other’s. You can see an example in our building better charts event.
For more, see our article on multi-level aggregations.
8. Share and reuse bits of code with SQL snippets
You can save a bit of SQL code as a snippet and refer to it like so:
SELECT
    product_id
FROM
    orders
WHERE
    total < {{snippet: average order total}}
You can find existing snippets in the right sidebar of the SQL editor by clicking on the code icon. From there you can insert existing snippets, or create your own.
You can also highlight parts of your code to save it as a snippet. See our full article on SQL snippets.
9. Reference results of any saved question or model in a SQL query via common table expressions
If you’re using a SQL database that supports common table expressions (CTEs), you can create tags that will be substituted with the SQL query of a referenced question. That way you can write your query once and reference it across multiple questions, and quickly debug your SQL queries as you’re working.
Read more about CTE syntax to get started.
10. Keep collections organized with drag-and-drop, and bulk moves
You can drag and drop items from collection to collection.
You can also click on an item’s icon to select it, useful for when you want to move or archive a bunch of questions and dashboards all at once.
For more on collections, see our docs.
You might also enjoy
All posts
 Feb 26, 2024 in Using Metabase
Embed a Metabase dashboard in Zendesk
Get the customer data and insights you need automatically filtered and ready for use within your support tickets. You can also embed a dashboard in Salesforce, Stripe, Jira, or platforms that allow embedding URLs.
Ignacio Beines Furcada and Sarina Bloodgood
‧
5 min read