





What does an email engagement dashboard show in Metabase?
An email engagement dashboard shows whether lifecycle email is reaching inboxes and earning clicks — delivery, bounces, complaints, list growth, and automation performance in one governed view. It combines campaign stats from tools like Mailchimp and ActiveCampaign with event streams from transactional senders like SendGrid, Postmark, and Resend.
For: lifecycle and email marketers, marketing ops, and growth teams. Grain: one row per campaign send (with counts), plus message-level events from webhooks for transactional mail.
What does an email engagement dashboard look like?
Here’s the layout this guide builds: the send-to-click funnel and headline rates at the top, then the deliverability trends that explain whether mail is reaching inboxes, then list health, automations, and the per-campaign detail you drill into when a rate moves.
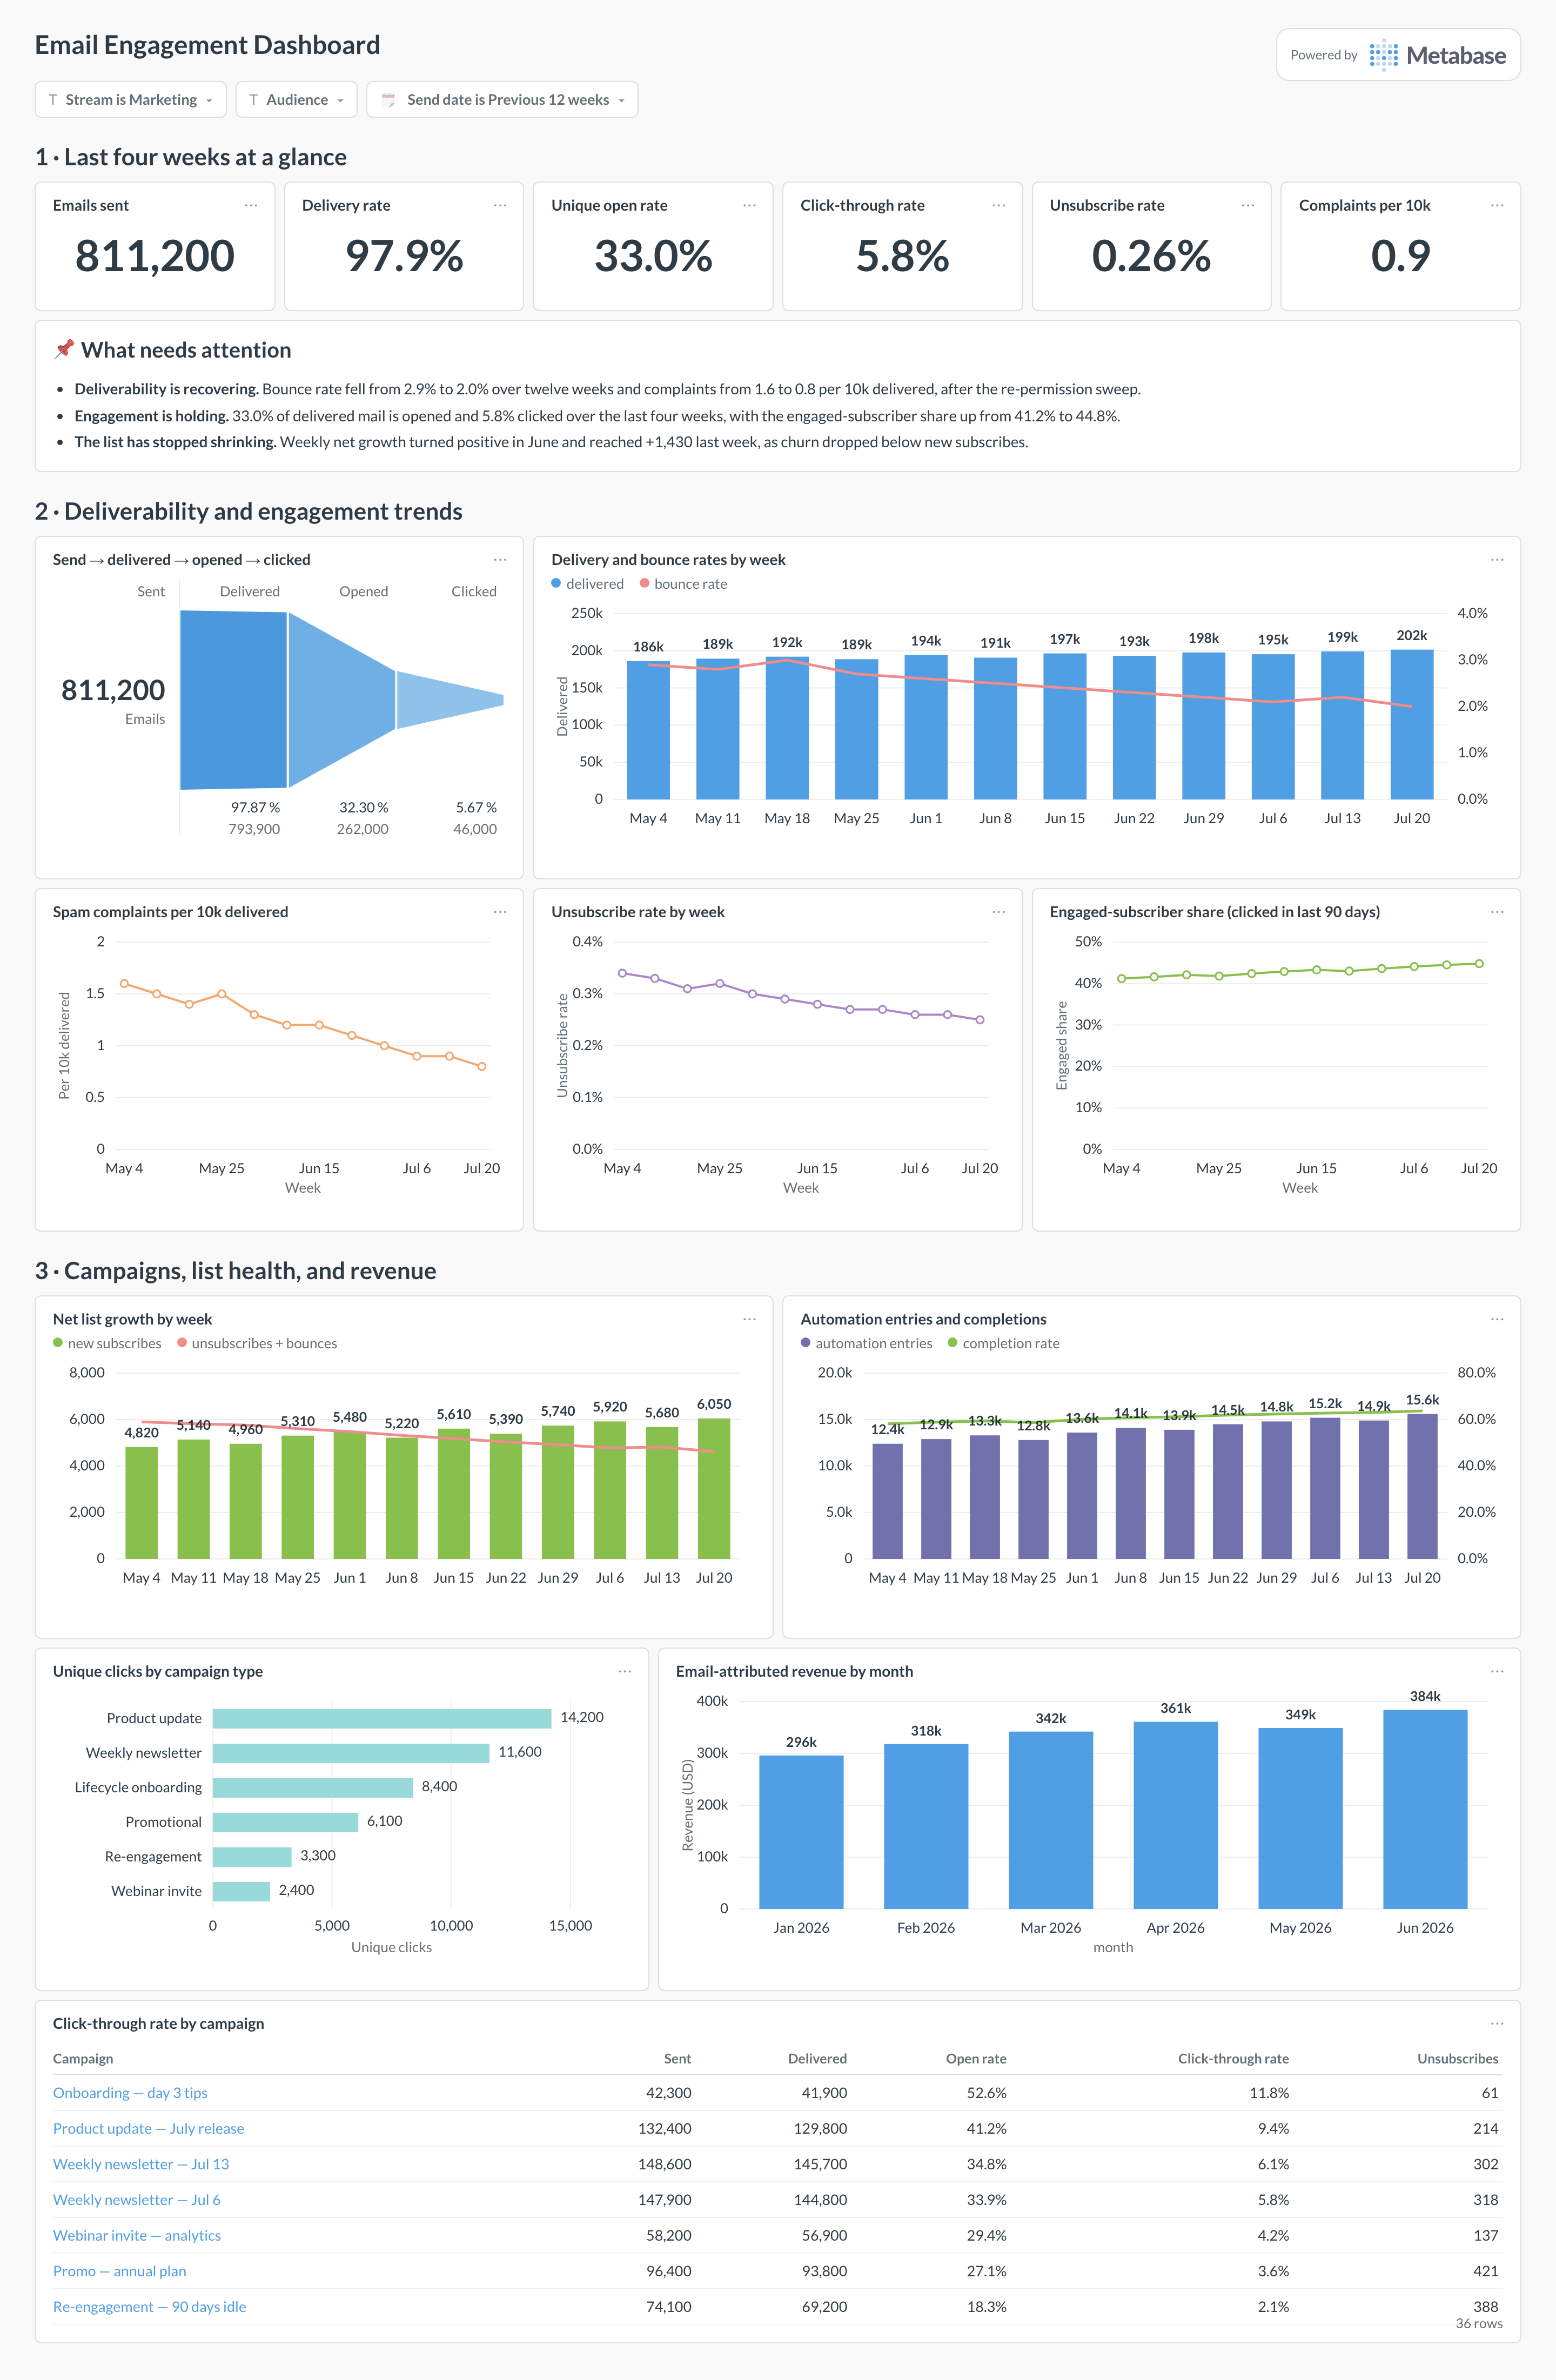
An example email engagement dashboard in Metabase, built from Mailchimp campaign stats and SendGrid event data. Figures are illustrative.
Which cards belong on an email engagement dashboard?
- Click-through rate by campaign (table)
- Delivery and bounce rates by week (combo)
- Spam complaints per 10k delivered (line)
- Unsubscribe rate trend (line)
- Net list growth — subscribes vs. unsubscribes and bounces (combo)
- Automation entries and completions (combo)
- Engaged-subscriber share — clicked in the last 90 days (line)
- Email-attributed revenue, where tracked (bar)
What data does the dashboard need?
email_campaign_stats— campaign, send date, sends, delivered, unique clicks, bounces, spam complaints, and unsubscribes.- List membership changes — subscribes, unsubscribes, and suppressions over time — for the net growth and engaged-share cards.
- Message-level events captured via webhooks from transactional senders (SendGrid, Postmark, Resend), since their native retention windows are short.
How do you build it?
- Sync campaign stats and list data from the marketing platform (see the Mailchimp and ActiveCampaign guides for routes).
- Point transactional senders’ event webhooks at a collector that writes to the warehouse — before the retention windows expire the history.
- Tag a
streamon every row (marketing vs. transactional) and normalize rate denominators: bounces over sends, clicks and complaints over delivered. - Build the rate trends, per-campaign table, and list-health cards, with stream and audience filters across all of them.
Example card SQL
SELECT
date_trunc('week', send_date) AS week,
SUM(sends) AS sends,
SUM(delivered) AS delivered,
ROUND(
  100.0 * SUM(delivered) / NULLIF(SUM(sends), 0), 2
) AS delivery_rate_pct,
ROUND(
  100.0 * SUM(bounces) / NULLIF(SUM(sends), 0), 2
) AS bounce_rate_pct,
ROUND(
  100.0 * SUM(unique_clicks) / NULLIF(SUM(delivered), 0), 2
) AS ctr_pct,
ROUND(
  10000.0 * SUM(spam_complaints) / NULLIF(SUM(delivered), 0), 2
) AS complaints_per_10k
FROM email_campaign_stats
GROUP BY 1
ORDER BY 1;
Related
Metrics
Integrations
Dashboards
FAQ
Are open rates still worth tracking?
Should transactional and marketing email be measured together?
stream field on every row, filter every rate card by it, and mirror the separation senders like SendGrid and Postmark enforce with separate subaccounts and message streams.Why do transactional email events need a warehouse sync?
What are the early warning signs of a deliverability problem?
How do you connect email clicks to actual conversions?
utm_medium=email and a campaign name matching the sender's campaign records, and the click lands in GA4 and your signups table like any other channel. From there the marketing funnel dashboard can carry email through to conversion — which is how the email-attributed revenue card stops depending on the sender's own generous attribution window.