





What is click-through rate, and how do you measure it in Metabase?
Click-through rate is clicks divided by the opportunity to click — ad impressions in Google Ads or Meta Ads, search impressions in Google Search Console, delivered emails in Mailchimp or SendGrid. It's a health signal for creative and relevance, not a business outcome — and the denominator changes with every context.
clicks / impressions. Email: unique_clicks / delivered. Search: clicks / search impressions, read alongside position. Never blend
the three, and never average pre-computed rates — re-aggregate from raw
counts.
What does a click-through rate chart look like in Metabase?
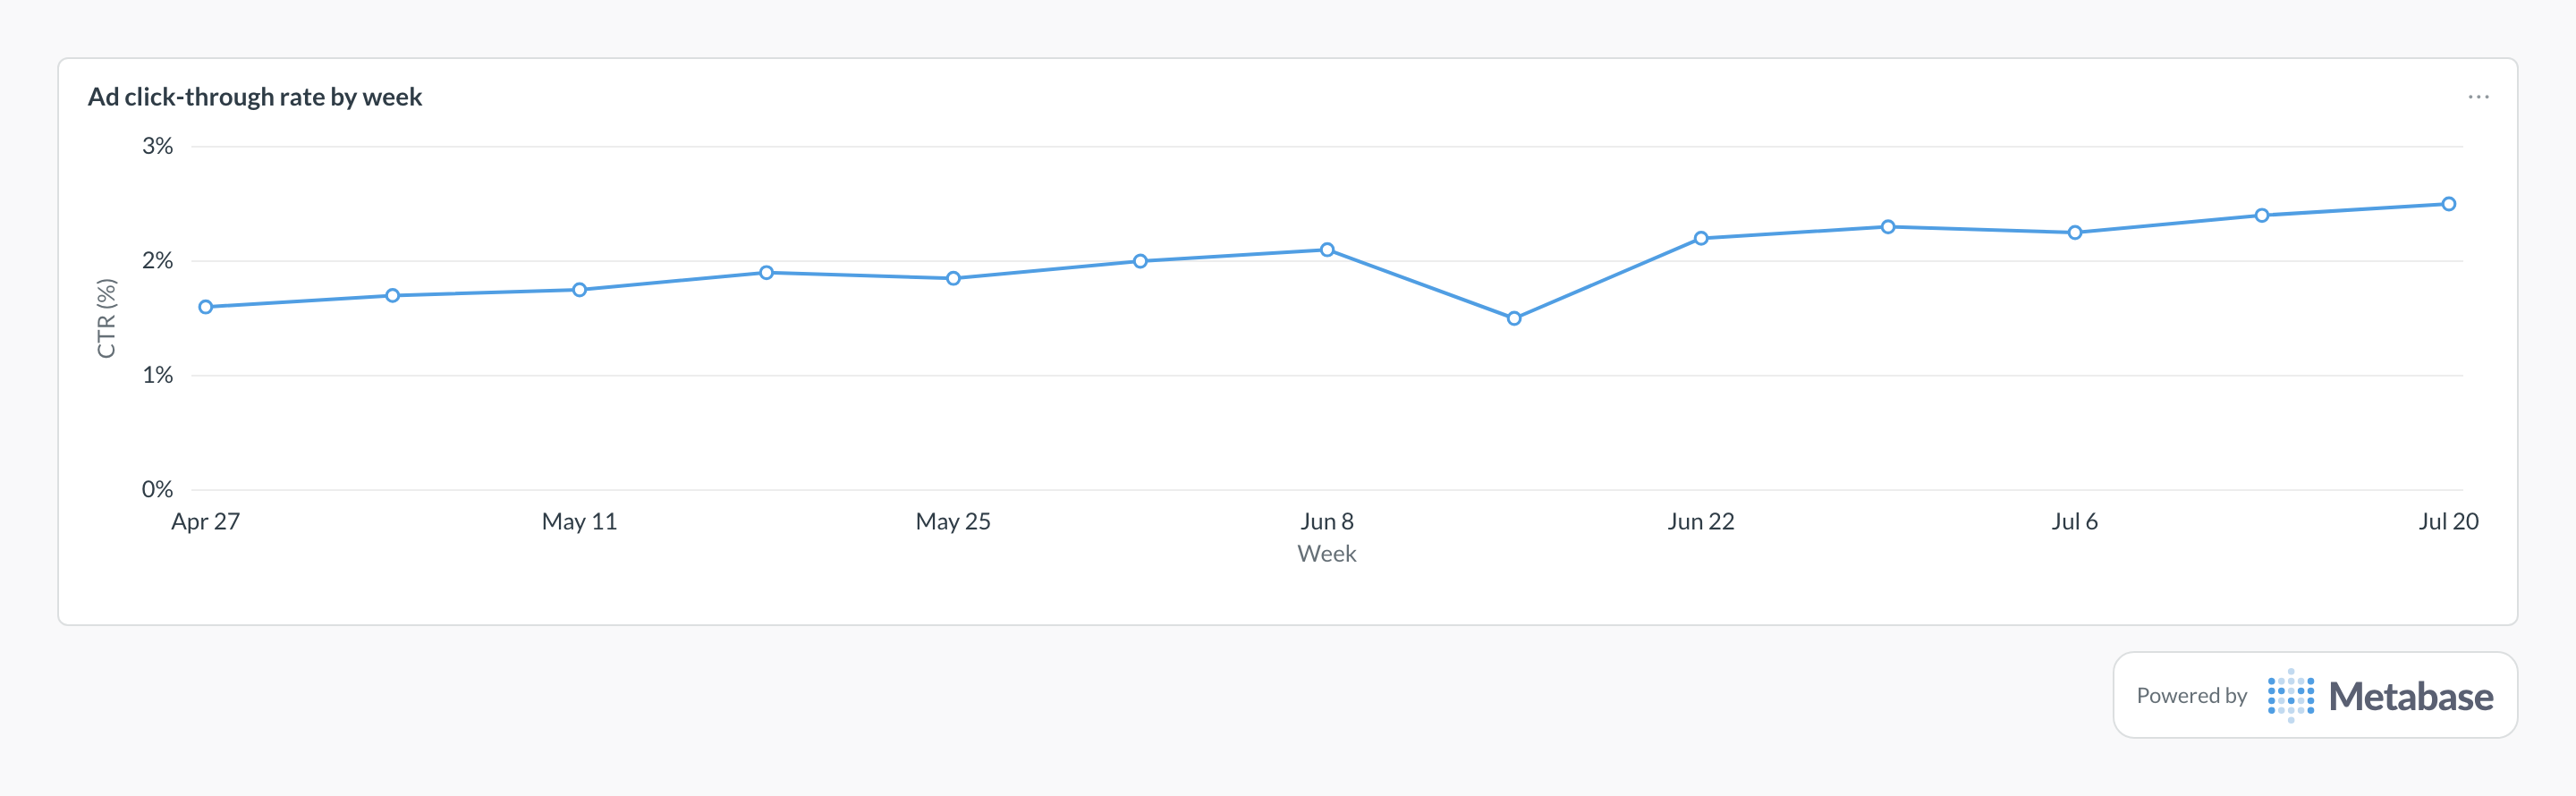
Chart ad CTR per week as a line and read the slow climb as creative and targeting iteration doing its job. A one-week dip like Jun 15's usually coincides with a creative rotation or a push into a colder audience — worth a note on the card, and a rollback only if it doesn't recover.
What CTR measures
Whether the message earned the click it asked for. In paid channels it's a creative and targeting signal — a falling CTR usually means ad fatigue or a mismatched audience, and it drags quality scores and cost per click with it. In organic search it measures how compelling your title and snippet are for the position you hold. In email — now that Apple Mail Privacy Protection has inflated open rates past usefulness — CTR is the engagement headline.
What it doesn't measure is value. A high CTR on traffic that never converts is an expensive compliment. Read it upstream of landing-page conversion rate and ROAS, not instead of them.
What data does it need?
-
For ads: a daily performance table (
ad_performance_daily) withimpressionsandclicksby campaign, ad group, and placement. -
For email: campaign stats with
deliveredandunique_clicks— unique, not total, so one enthusiastic reader doesn't inflate the rate. - For search: Search Console performance rows with clicks, impressions, and average position by query and page.
SQL patterns
SELECT
  date_trunc('week', stat_date) AS week,
  campaign_name,
  SUM(clicks) AS clicks,
  SUM(impressions) AS impressions,
  ROUND(100.0 * SUM(clicks) / NULLIF(SUM(impressions), 0), 2) AS ctr_pct
FROM ad_performance_daily
WHERE stat_date >= CURRENT_DATE - INTERVAL '90 days'
GROUP BY 1, 2
ORDER BY 1, 2;SELECT
campaign_name,
send_date,
SUM(delivered) AS delivered,
SUM(unique_clicks) AS unique_clicks,
ROUND(100.0 * SUM(unique_clicks) / NULLIF(SUM(delivered), 0), 2)
AS email_ctr_pct
FROM email_campaign_stats
WHERE send_date >= CURRENT_DATE - INTERVAL '90 days'
GROUP BY 1, 2
ORDER BY send_date DESC;Pitfalls
AVG(ctr) over rows weights a 100-impression placement the same as
a million-impression one. Sum clicks and impressions first, then divide — one
campaign at scale can move the real number while the naive average sits still.
Where this metric applies
- Google Ads + Metabase — clicks and impressions by campaign, ad group, and keyword
- Meta Ads + Metabase — CTR by campaign, ad set, and creative
- Google Search Console + Metabase — organic CTR by query and page, with position
- Mailchimp + Metabase — unique clicks over delivered by campaign
- SendGrid + Metabase — click events from the event webhook
Related
Metrics
Dashboards
Terms
FAQ
How do you calculate CTR?
clicks / impressions from platforms like Google Ads or Meta Ads. For organic search it's clicks over search impressions from Google Search Console. For email it's unique_clicks / delivered. Same name, three different metrics — never blend them into one number.What's a good CTR?
Why is email CTR more useful than open rate now?
Does CTR depend on search position?
How do you track CTR in Metabase?
SUM(clicks) / NULLIF(SUM(impressions), 0) — always re-aggregate from raw counts rather than averaging pre-computed rates. Chart each channel on its own card and keep the trend next to landing-page conversion rate so you can see whether clicks actually convert.