





What does a paid channel performance dashboard show in Metabase?
A paid channel performance dashboard shows where ad budget goes and what it returns, across every platform at once. It combines daily campaign stats from Google Ads, Meta Ads, LinkedIn Ads, and TikTok Ads into one unioned model, so spend and return are compared on the same definitions instead of four reporting UIs.
For: performance marketers, growth leads, and marketing ops.
Grain: one row per campaign per day per channel, in a unioned
ad_performance_daily model.
What does a paid channel performance dashboard look like?
Here’s the layout this guide builds, at the grain of one campaign per day per channel: spend and efficiency headlines first, then where budget goes and what each channel returns, then the campaign-level cards that show which line items are carrying the result. Read it weekly when reallocating budget.
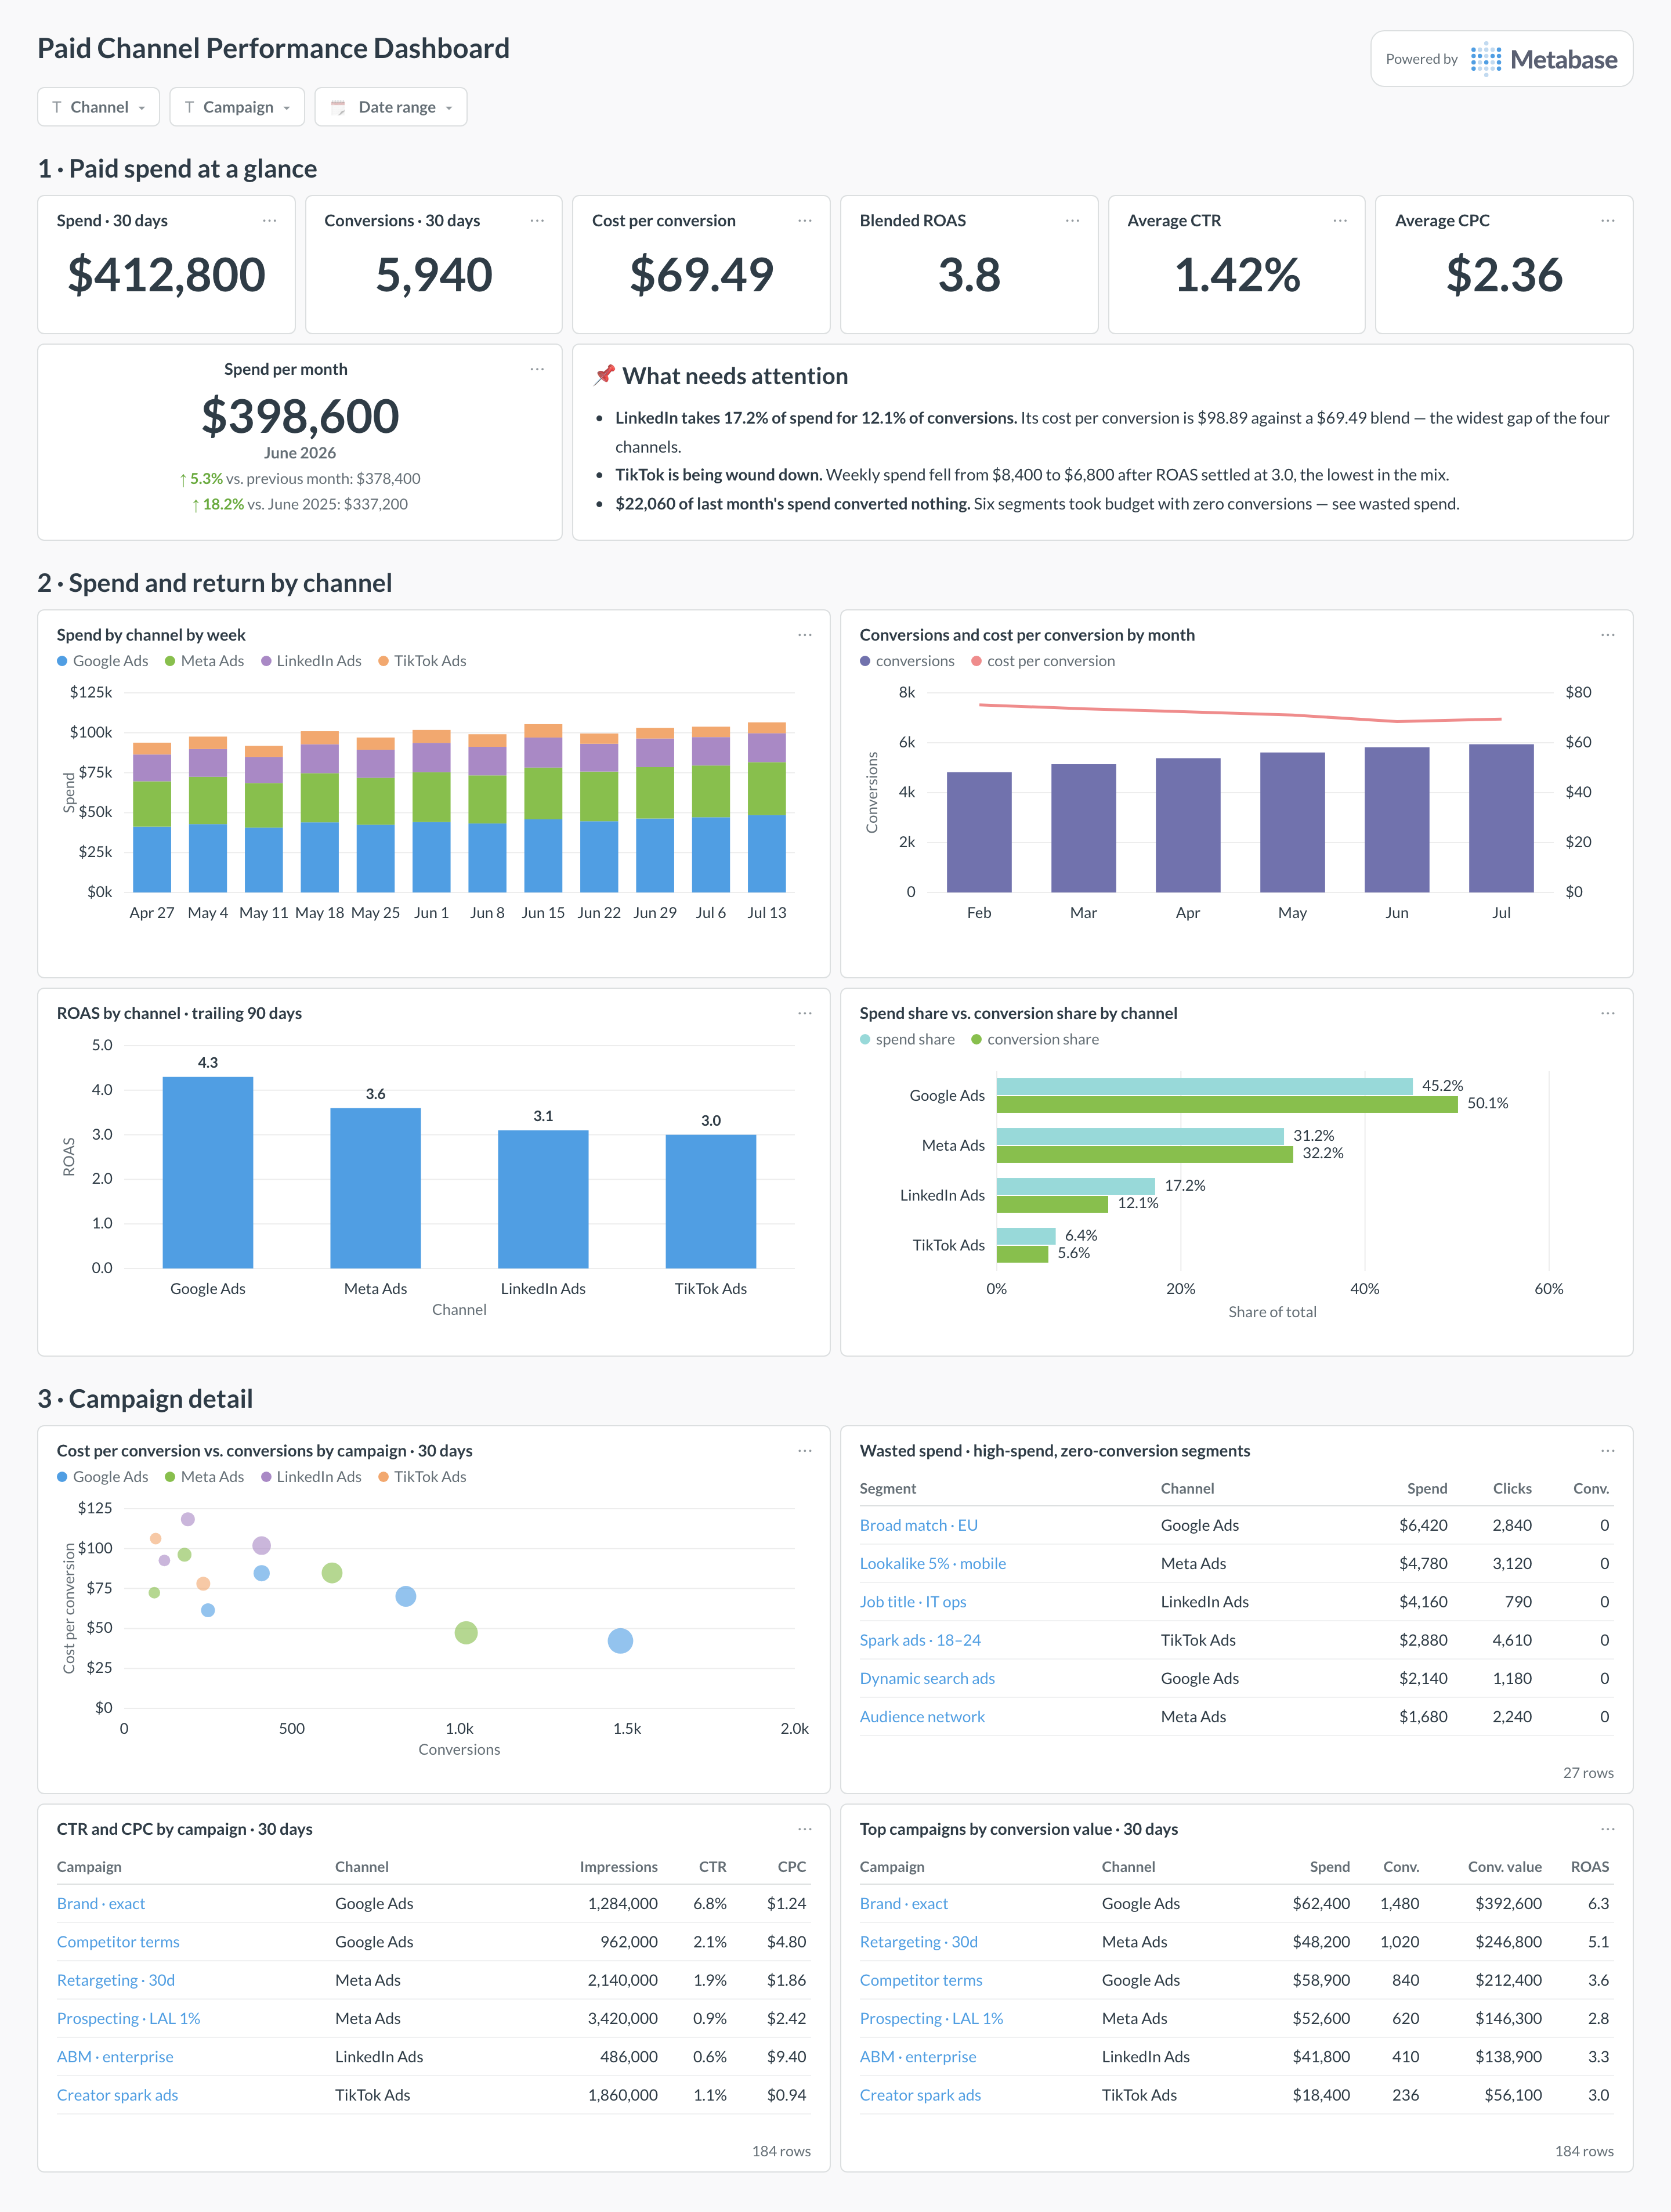
An example paid channel performance dashboard in Metabase, built from unioned Google Ads, Meta Ads, LinkedIn Ads, and TikTok Ads data. Figures are illustrative.
Which cards belong on a paid channel performance dashboard?
- Spend by channel by week (stacked bar)
- ROAS by channel, trailing 90 days (bar)
- Conversions and cost per conversion trend (combo)
- CTR and CPC by campaign (table)
- Top campaigns by conversion value (table)
- Wasted spend — high-spend, zero-conversion segments (table)
- Spend share vs. conversion share by channel (table)
- Month-over-month spend change (number with trend)
What data does the dashboard need?
ad_performance_daily— the unioned model with channel, campaign, stat date, spend, impressions, clicks, conversions, and conversion value.campaignsentity table with status, objective, and owner, so campaign-level cards carry context beyond the name string.- Optional: a customers or revenue table joined on click IDs or UTMs, for true CAC instead of platform-attributed cost per conversion.
How do you build it?
- Sync each platform’s daily campaign report into the warehouse (see the Google Ads and Meta Ads guides for routes).
- Union the raw tables into
ad_performance_dailywith one column set — normalize currency units and map each platform’s action types to a single conversion definition. - Decide the conversion source of truth: keep platform columns for in-channel views, but compute cross-channel totals from one source.
- Build the cards, add channel and date filters, and set per-channel drill-throughs down to campaign level.
Example card SQL
SELECT
channel,
date_trunc('month', stat_date) AS month,
SUM(spend) AS spend,
SUM(conversions) AS conversions,
ROUND(SUM(spend) / NULLIF(SUM(conversions), 0), 2)
  AS cost_per_conversion,
ROUND(SUM(conversion_value) / NULLIF(SUM(spend), 0), 2) AS roas
FROM ad_performance_daily
GROUP BY 1, 2
ORDER BY 2, 1;
Related
Metrics
Integrations
Dashboards
FAQ
What is a paid channel performance dashboard?
Why can't platform-reported conversions just be summed across channels?
How do you union ad platforms into one model?
ad_performance_daily view that unions them with a fixed column set: channel, campaign, stat_date, spend, impressions, clicks, conversions, conversion_value. Normalize the awkward parts in the view — micros to currency for Google, platform-specific action types mapped to one conversion definition — so every card queries a single table instead of four schemas.