





What does a marketing funnel dashboard show in Metabase?
A marketing funnel dashboard tracks visit → lead → activation → customer, by channel and campaign, in one governed view. It joins traffic from Google Analytics 4 or Plausible, signups with UTM attribution, product events from tools like Amplitude, and customer records from the CRM — so conversion between stages is measured in the warehouse, not guessed from four separate tools.
For: growth and demand-gen marketers, marketing ops, and founders. Grain: one row per lead, with UTM attribution and stage timestamps (created, activated, converted).
What does a marketing funnel dashboard look like?
Here’s the layout this guide builds: the visit-to-customer funnel and its headline rates first, then the channel and volume trends, then the campaign, landing-page, and cost cards that show which part of the funnel is worth spending on.
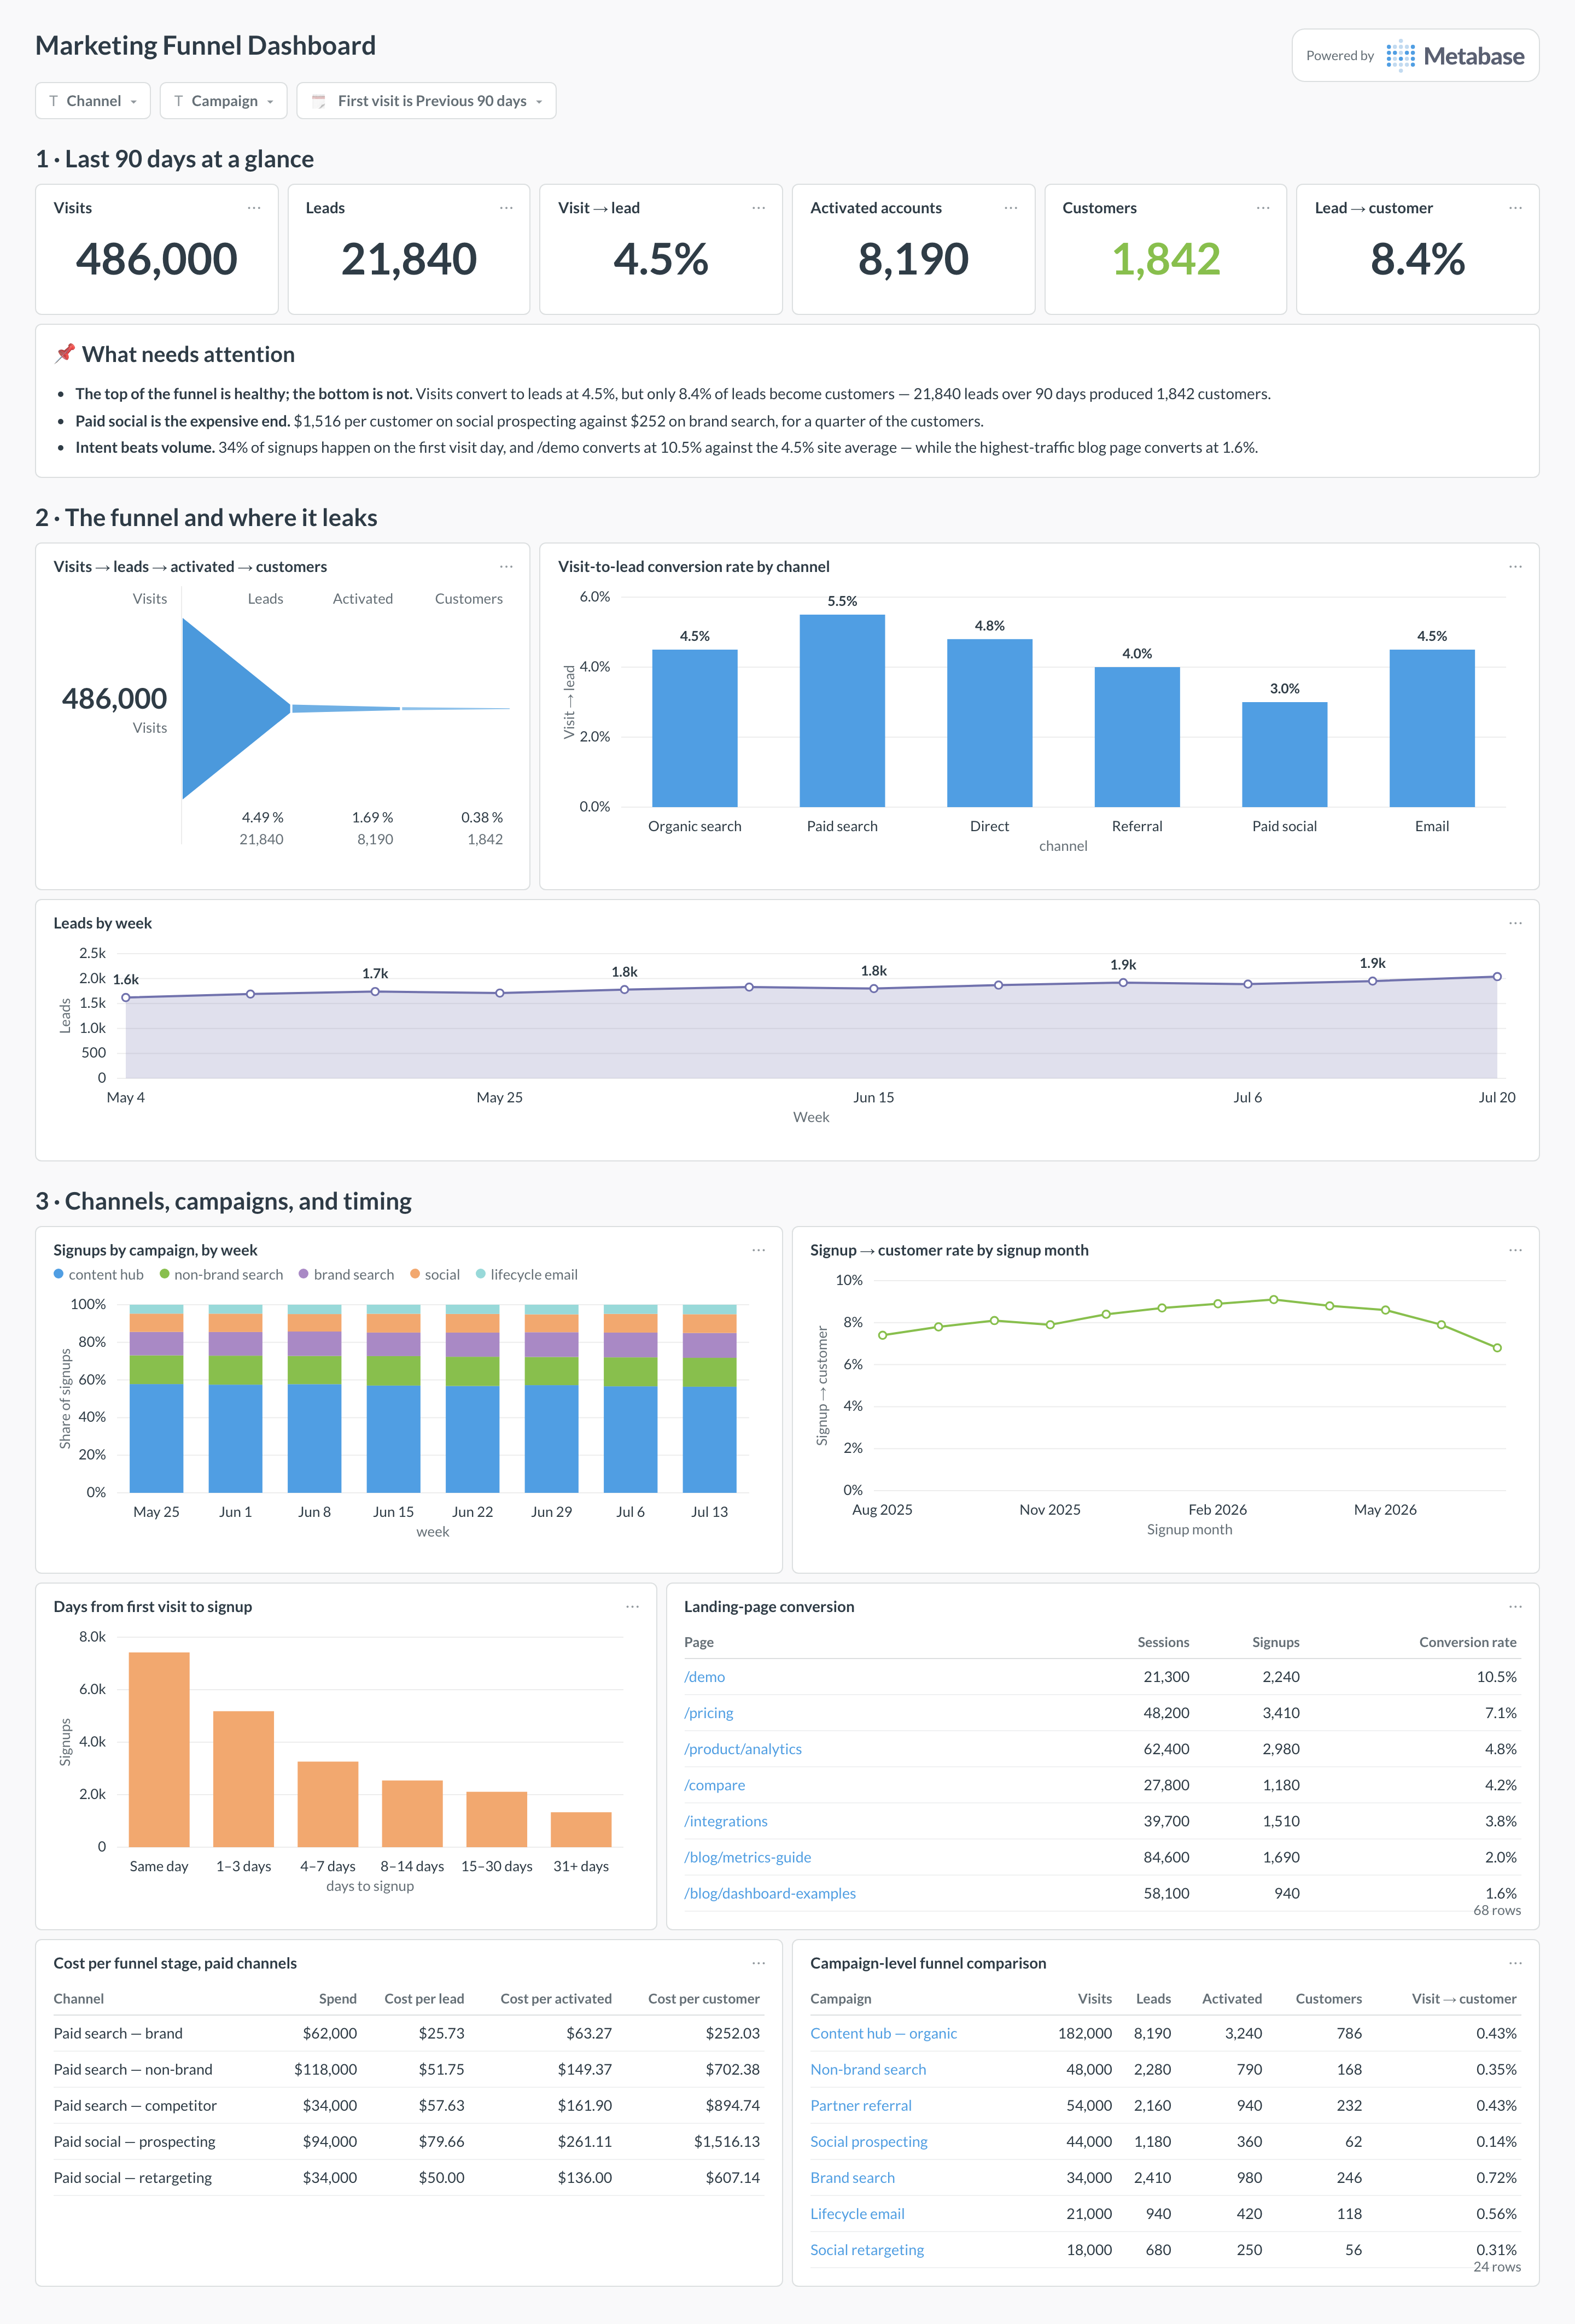
An example marketing funnel dashboard in Metabase, built from Google Analytics 4 traffic, signups, and CRM records. Figures are illustrative.
Which cards belong on a marketing funnel dashboard?
- Funnel steps — visits, leads, activated, customers, with conversion between each (funnel)
- Visit-to-lead conversion rate by channel (bar)
- Signups by campaign by week (stacked bar)
- Landing-page conversion — sessions, signups, and rate per page (table)
- Time to convert — days from first visit to signup (bar)
- Cost per funnel stage, where ad spend is synced (table)
- Campaign-level funnel comparison (table)
- Cohorted signup → customer rate by signup month (line)
What data does the dashboard need?
traffic_rollups— sessions by date, channel, and landing page from GA4 or Plausible.- A
leads(orsignups) table with UTM attribution —utm_source,utm_medium,utm_campaign— captured at signup. - Product events for the activation step, from Amplitude, PostHog, or Mixpanel.
- A
customerstable from billing or the CRM (e.g. HubSpot), with a lead ID or email to join on.
How do you build it?
- Sync traffic, signups, product events, and CRM records into one warehouse — the marketing & growth integrations catalog covers the routes per tool.
- Normalize the UTM taxonomy and map raw source/medium values to a fixed channel list; this mapping is the backbone of every by-channel card.
- Define each stage precisely — what counts as a lead, which event marks activation, when a customer converts — and pick one attribution rule.
- Build the funnel and per-channel cards, add channel and campaign filters, and wire drill-throughs from stage counts to lead-level tables.
Example card SQL
SELECT
l.utm_source AS channel,
COUNT(*) AS leads,
COUNT(*) FILTER (WHERE l.activated_at IS NOT NULL) AS activated,
COUNT(*) FILTER (WHERE c.customer_id IS NOT NULL) AS customers,
ROUND(
  100.0 * COUNT(*) FILTER (WHERE l.activated_at IS NOT NULL) / COUNT(*), 1
) AS lead_to_activated_pct,
ROUND(
  100.0 * COUNT(*) FILTER (WHERE c.customer_id IS NOT NULL) / COUNT(*), 1
) AS lead_to_customer_pct
FROM leads l
LEFT JOIN customers c ON c.lead_id = l.lead_id
WHERE l.created_at >= now() - interval '90 days'
GROUP BY 1
ORDER BY leads DESC;
Related
Metrics
Integrations
Dashboards
FAQ
How do you keep UTM taxonomy consistent across the funnel?
utm_source=FB while another writes facebook silently splits the funnel. Publish a taxonomy (lowercase, fixed vocabulary for utm_source and utm_medium, a naming pattern for utm_campaign), generate links from a shared builder, and keep a mapping table in the warehouse to normalize the strays that get through. Every card on this dashboard — and most of marketing analytics — inherits its accuracy from this one convention.Should the funnel use first-touch or last-touch attribution?
Why does the funnel need a stable user or lead ID across tools?
user_id at signup, pass it to the product analytics tool via its identify call (see the Amplitude and PostHog guides), and store it (or a reliable email join) on the CRM contact so HubSpot records tie back to the same person.