





What is landing-page conversion rate, and how do you measure it in Metabase?
Landing-page conversion rate is conversions divided by sessions, per landing page. The per-page part is the point: sitewide conversion rates move with channel mix, not page quality, so the actionable number lives at the page level. Measure it in Metabase from session data synced from Google Analytics 4 or Plausible.
conversions / sessions grouped by landing
page, with a minimum-sessions threshold (HAVING sessions >= 100) before ranking anything. Read rate and volume together: a 20% page with
50 sessions loses to a 5% page with 10,000.
What does a landing-page conversion rate chart look like in Metabase?
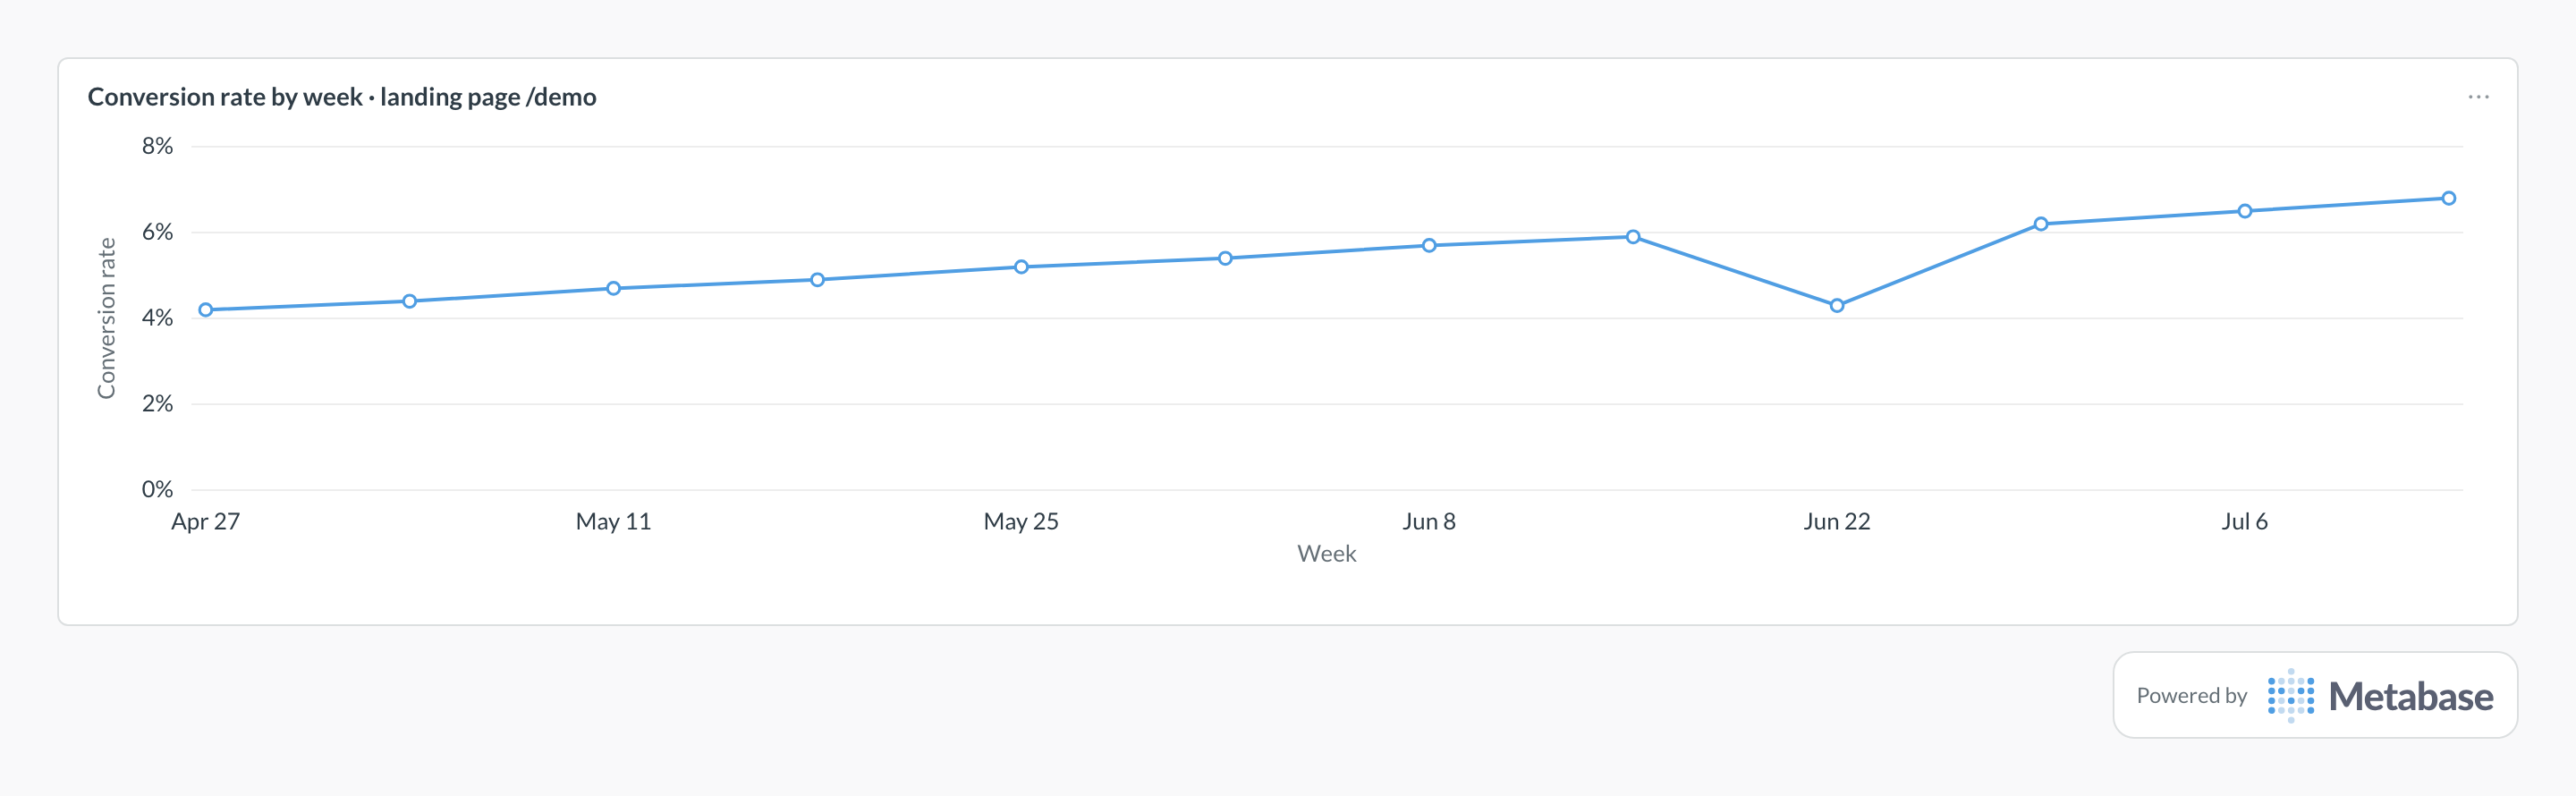
Track conversions divided by sessions for a single landing page week by week: the climb from about 4% to nearly 7% is what compounding copy and layout tests look like. A one-week dip like Jun 22's usually means the traffic mix shifted — a cold display burst diluting the sessions — so split the week by UTM source before rolling back any page change.
What landing-page conversion rate measures
How well a specific page turns its visitors into signups, leads, or purchases. Because it's scoped to one page, it isolates page quality from traffic quality — mostly. A page's rate still reflects who lands on it: a pricing page converts high-intent visitors a blog post never sees. Compare pages against their own history and against pages with similar intent, and segment by source via UTM parameters when a rate moves and you need to know whether the page changed or the traffic did.
And always read rate next to volume. Ranking pages by rate alone crowns low-traffic flukes; the pages worth optimizing are the ones where volume times rate-improvement is largest.
What data does it need?
-
A
sessionstable withlanding_page,session_start, and aconvertedflag (or a join to a conversions table keyed by session). -
UTM fields (
utm_source,utm_medium,utm_campaign) captured on the session, so email and ad clicks credit their sources. - One conversion definition, owned in SQL — not one number from GA4, another from the CRM, and a third from the ad platform.
SQL patterns
SELECT
  landing_page,
  COUNT(*) AS sessions,
  COUNT(*) FILTER (WHERE converted) AS conversions,
  ROUND(
    100.0 * COUNT(*) FILTER (WHERE converted) / COUNT(*), 2
  ) AS conversion_rate_pct
FROM sessions
WHERE session_start >= CURRENT_DATE - INTERVAL '30 days'
GROUP BY 1
HAVING COUNT(*) >= 100
ORDER BY conversions DESC;SELECT
landing_page,
utm_source,
utm_campaign,
COUNT(*) AS sessions,
COUNT(*) FILTER (WHERE converted) AS conversions,
ROUND(
100.0 * COUNT(*) FILTER (WHERE converted) / COUNT(*), 2
) AS conversion_rate_pct
FROM sessions
WHERE session_start >= CURRENT_DATE - INTERVAL '30 days'
AND utm_source IS NOT NULL
GROUP BY 1, 2, 3
HAVING COUNT(*) >= 50
ORDER BY sessions DESC;Pitfalls
HAVING floor before sorting by rate, and
raise it when the base rate is low.
Where this metric applies
- Google Analytics 4 + Metabase — sessions, landing pages, and key events via the BigQuery export
- Plausible + Metabase — entry pages, goals, and UTM breakdowns
- Mailchimp + Metabase — email clicks joined to sessions and conversions via UTM parameters
Related
Metrics
Dashboards
Terms
FAQ
How do you calculate landing-page conversion rate?
COUNT(*) FILTER (WHERE converted) / COUNT(*) per landing_page. Define one conversion event, count it once per session, and hold that definition steady — a rate whose numerator quietly changed meaning is worse than no rate at all.Why page-level instead of a sitewide conversion rate?
How many sessions before a page's rate is trustworthy?
HAVING COUNT(*) >= 100 clause keeps flukes off the chart. For A/B-level decisions you need proper significance testing, but for monitoring, a minimum-sessions threshold removes most of the lying.How do you credit email and ad traffic to landing pages?
utm_source, utm_medium, and utm_campaign on the session, and group conversion rate by landing page and source. That joins clicks from Mailchimp campaigns or paid ads to the sessions and conversions they produced — so you can see that the same page converts newsletter traffic at 8% and cold display traffic at 1%, which is a targeting insight, not a page problem. It's the same join that powers cost per lead by channel.