





What does a paid vs. organic acquisition dashboard show in Metabase?
A paid vs. organic acquisition dashboard shows how the growth mix splits between bought and earned traffic — and which way it's drifting. It combines channel-grouped sessions from Google Analytics 4 or Plausible, organic clicks from Google Search Console, and paid spend from the ad platforms in one governed view.
For: heads of marketing, SEO and performance leads, and founders watching CAC. Grain: one row per channel group per day in
traffic_rollups, joined to daily spend and Search Console performance.
What does a paid vs. organic acquisition dashboard look like?
Here’s the layout this guide builds: the acquisition mix at the top, then sessions, clicks, spend, and conversions side by side over time, then the mix-shift and efficiency cards that show which way the split is drifting. Read it monthly, when the CAC question comes up.
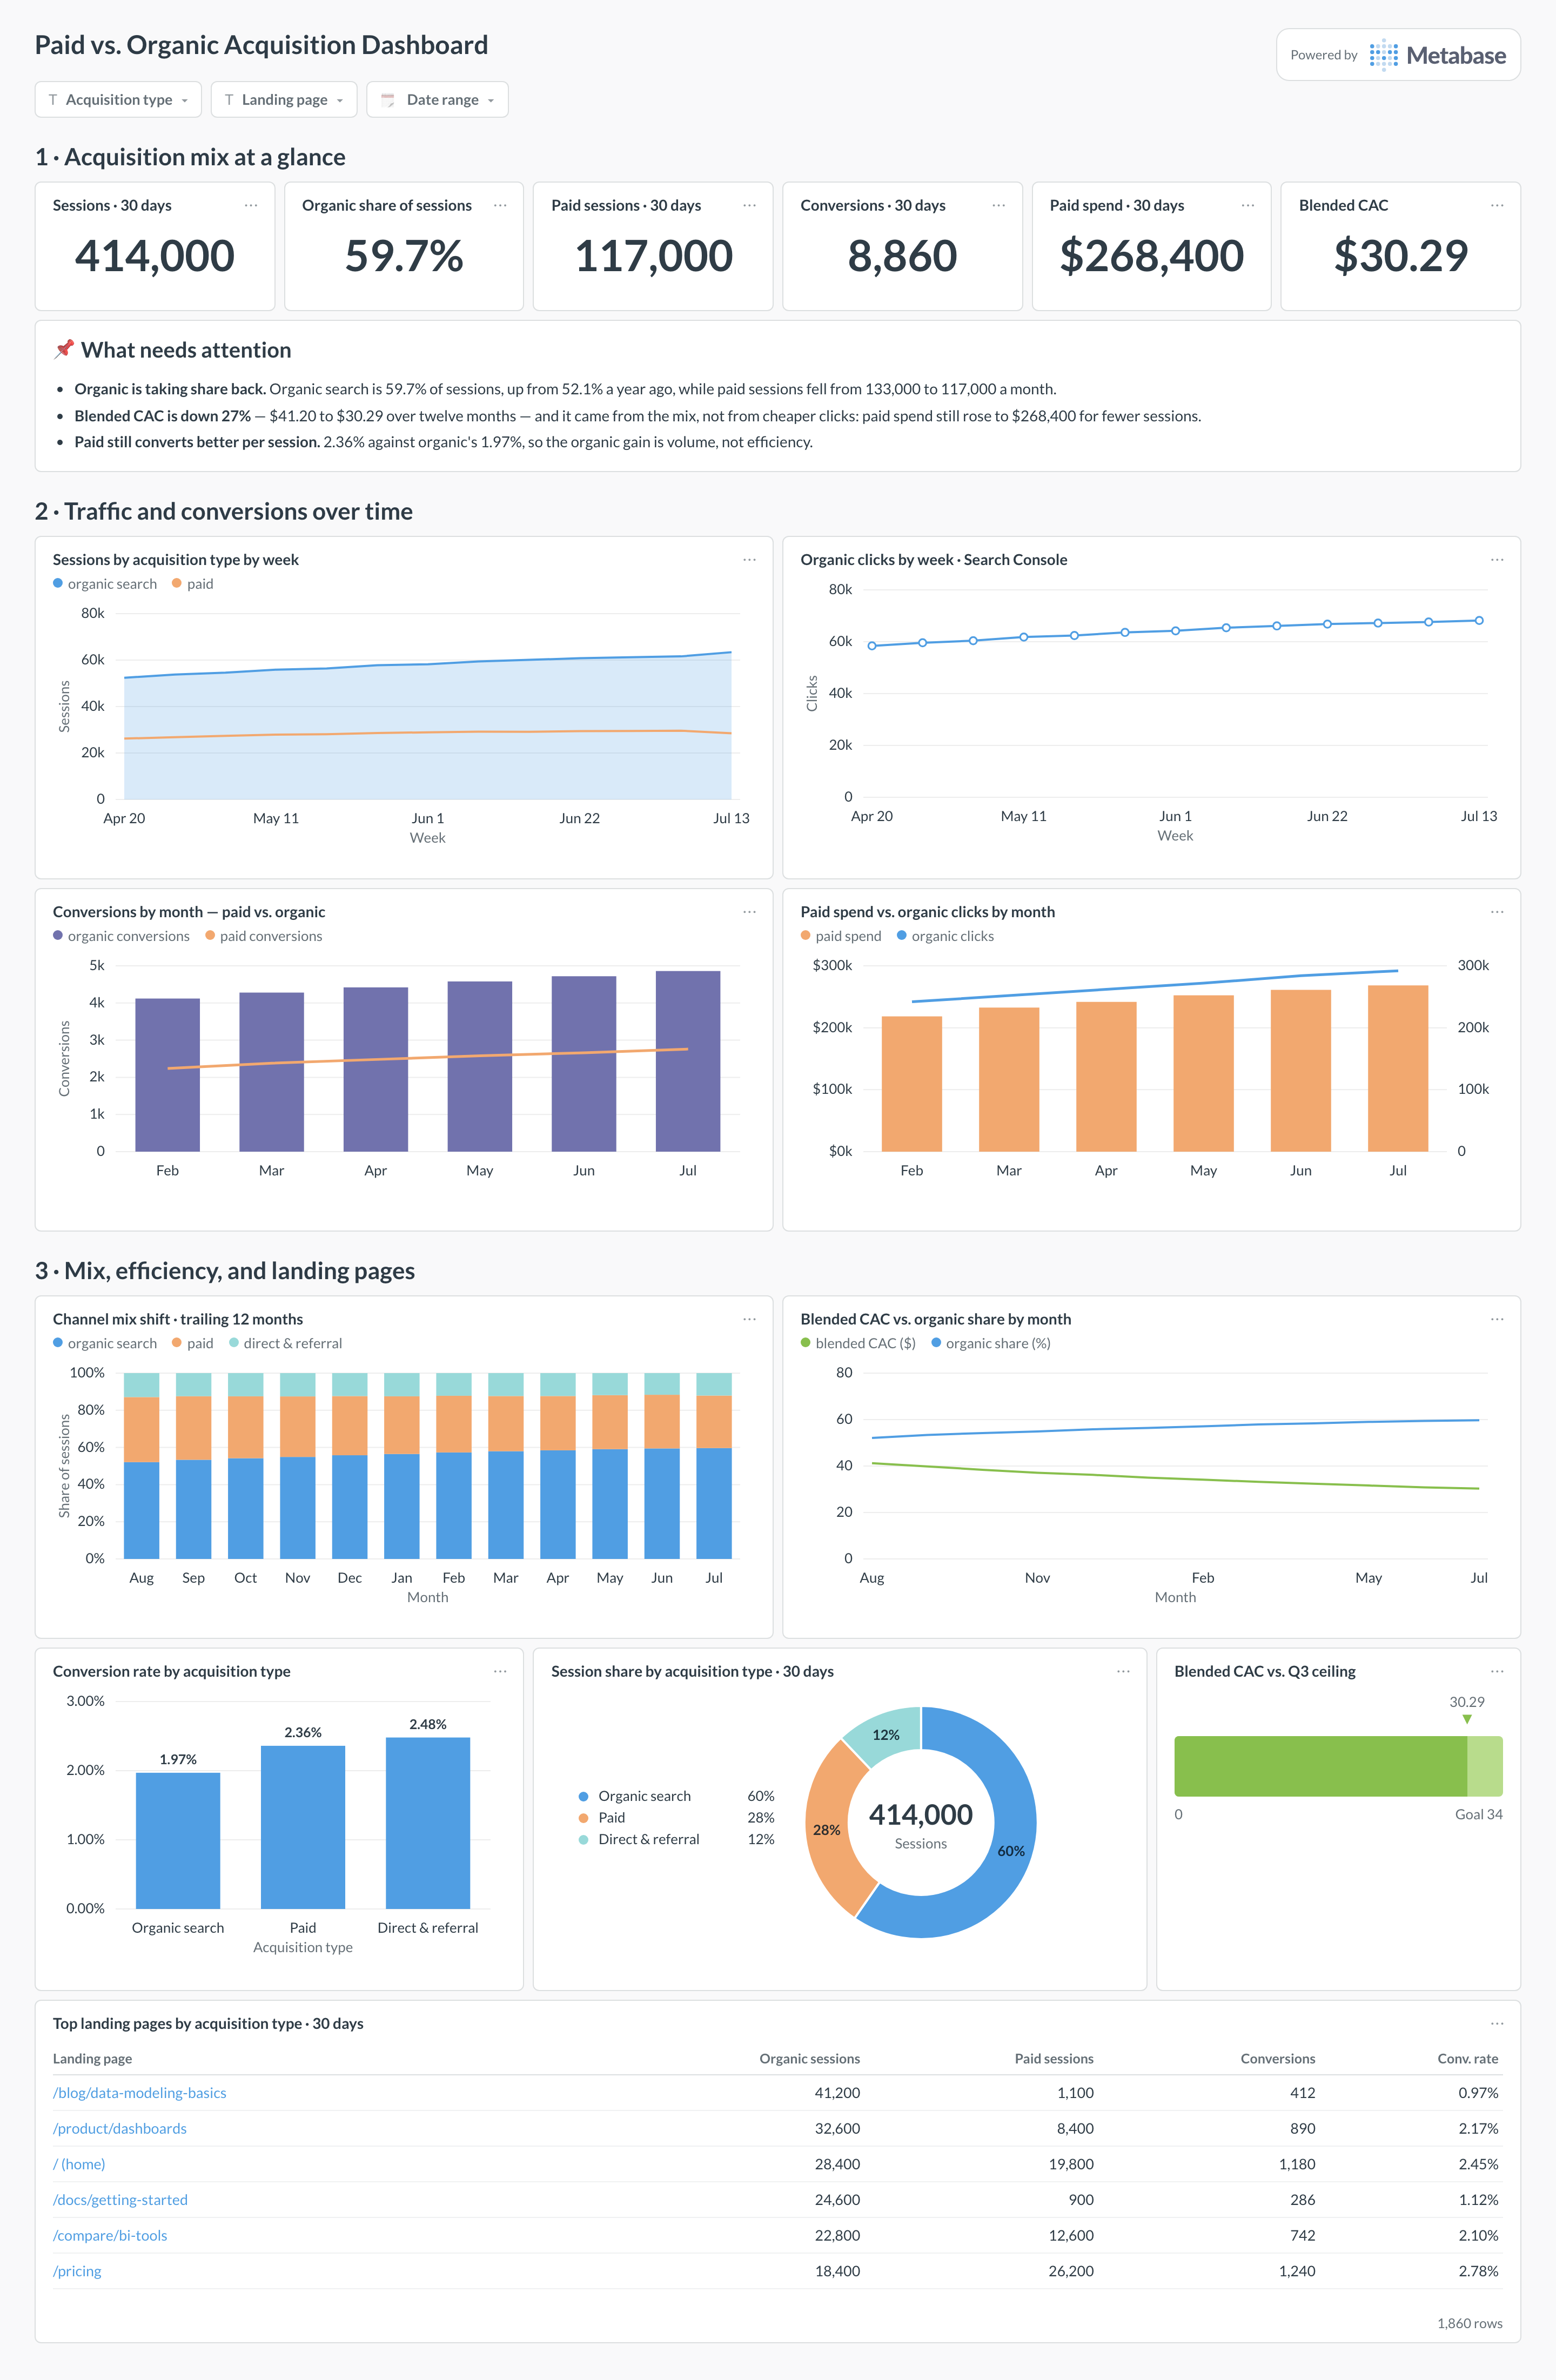
An example paid vs. organic acquisition dashboard in Metabase, built from Google Analytics 4, Search Console, and ad spend data. Figures are illustrative.
Which cards belong on a paid vs. organic acquisition dashboard?
- Sessions by acquisition type over time (stacked area)
- Conversions, paid vs. organic (combo)
- Organic clicks trend from Search Console (line)
- Paid spend vs. organic clicks (combo)
- Conversion rate by acquisition type (bar)
- Blended CAC vs. organic share (line)
- Top landing pages by acquisition type (table)
- Channel mix shift, trailing 12 months (area)
What data does the dashboard need?
traffic_rollupsfrom GA4 or Plausible — channel group, session date, sessions, and key events.gsc_performance_dailyfrom Search Console — clicks, impressions, and queries by date.ad_performance_dailyfor paid spend, the same unioned model that feeds the paid channel performance dashboard.
How do you build it?
- Sync the three sources into the warehouse: analytics rollups, Search Console daily performance, and unioned ad spend.
- Fix the channel mapping — enforce UTM tagging on paid traffic and decide where Direct and Referral land in the paid/organic split.
- Join on date at the channel-group grain; keep GSC clicks as their own series rather than forcing them to reconcile with analytics sessions.
- Build the mix cards, add a date-range filter, and drill from acquisition type down to landing page.
Example card SQL
WITH traffic AS (
SELECT
  date_trunc('month', session_date) AS month,
  -- everything bought: Paid Search/Social/Shopping/Video/Other,
  -- plus Display and Cross-network
  SUM(sessions) FILTER (
    WHERE channel_group LIKE 'Paid%'
      OR channel_group IN ('Display', 'Cross-network')
  ) AS paid_sessions,
  SUM(key_events) FILTER (
    WHERE channel_group LIKE 'Paid%'
      OR channel_group IN ('Display', 'Cross-network')
  ) AS paid_conversions,
  SUM(sessions) FILTER (WHERE channel_group = 'Organic Search')
    AS organic_sessions,
  SUM(key_events) FILTER (WHERE channel_group = 'Organic Search')
    AS organic_conversions
FROM traffic_rollups
GROUP BY 1
),
spend AS (
SELECT
  date_trunc('month', stat_date) AS month,
  SUM(spend) AS paid_spend
FROM ad_performance_daily
GROUP BY 1
)
SELECT
t.month,
t.paid_sessions,
t.organic_sessions,
ROUND(t.paid_conversions::numeric
  / NULLIF(t.paid_sessions, 0) * 100, 2) AS paid_conversion_rate,
ROUND(t.organic_conversions::numeric
  / NULLIF(t.organic_sessions, 0) * 100, 2) AS organic_conversion_rate,
s.paid_spend
FROM traffic t
LEFT JOIN spend s ON s.month = t.month
ORDER BY t.month;
Related
Metrics
Integrations
Dashboards
FAQ
What is a paid vs. organic acquisition dashboard?
How is "organic" defined?
traffic_rollups model so every card in GA4-based reporting uses the same definition.Why don't Search Console clicks match GA4 organic sessions?
Does paid search cannibalize branded organic traffic?
Which tools feed a paid vs. organic dashboard?
ad_performance_daily from the ad platforms for spend (see the paid channel performance dashboard for that model). More sources in the marketing and growth integrations catalog.