





What does an organic search performance dashboard show in Metabase?
An organic search performance dashboard shows whether search visibility is compounding: clicks, impressions, CTR, and position from Google Search Console data, split by branded and non-branded demand, with the pages and queries that are winning or losing. Synced to a warehouse, it keeps history past GSC's 16-month window and joins search data to the rest of the marketing stack.
For: SEO and content marketers, growth teams, and anyone accountable for organic traffic. Grain: one row per day × query × page (× country × device), from Search Console.
What does an organic search performance dashboard look like?
Here’s the layout this guide builds: totals and CTR at the top, then clicks, impressions, and average position over time, then the page- and query-level cards that say which content is winning. Read the trend cards monthly and the winners-and-losers tables whenever traffic moves.
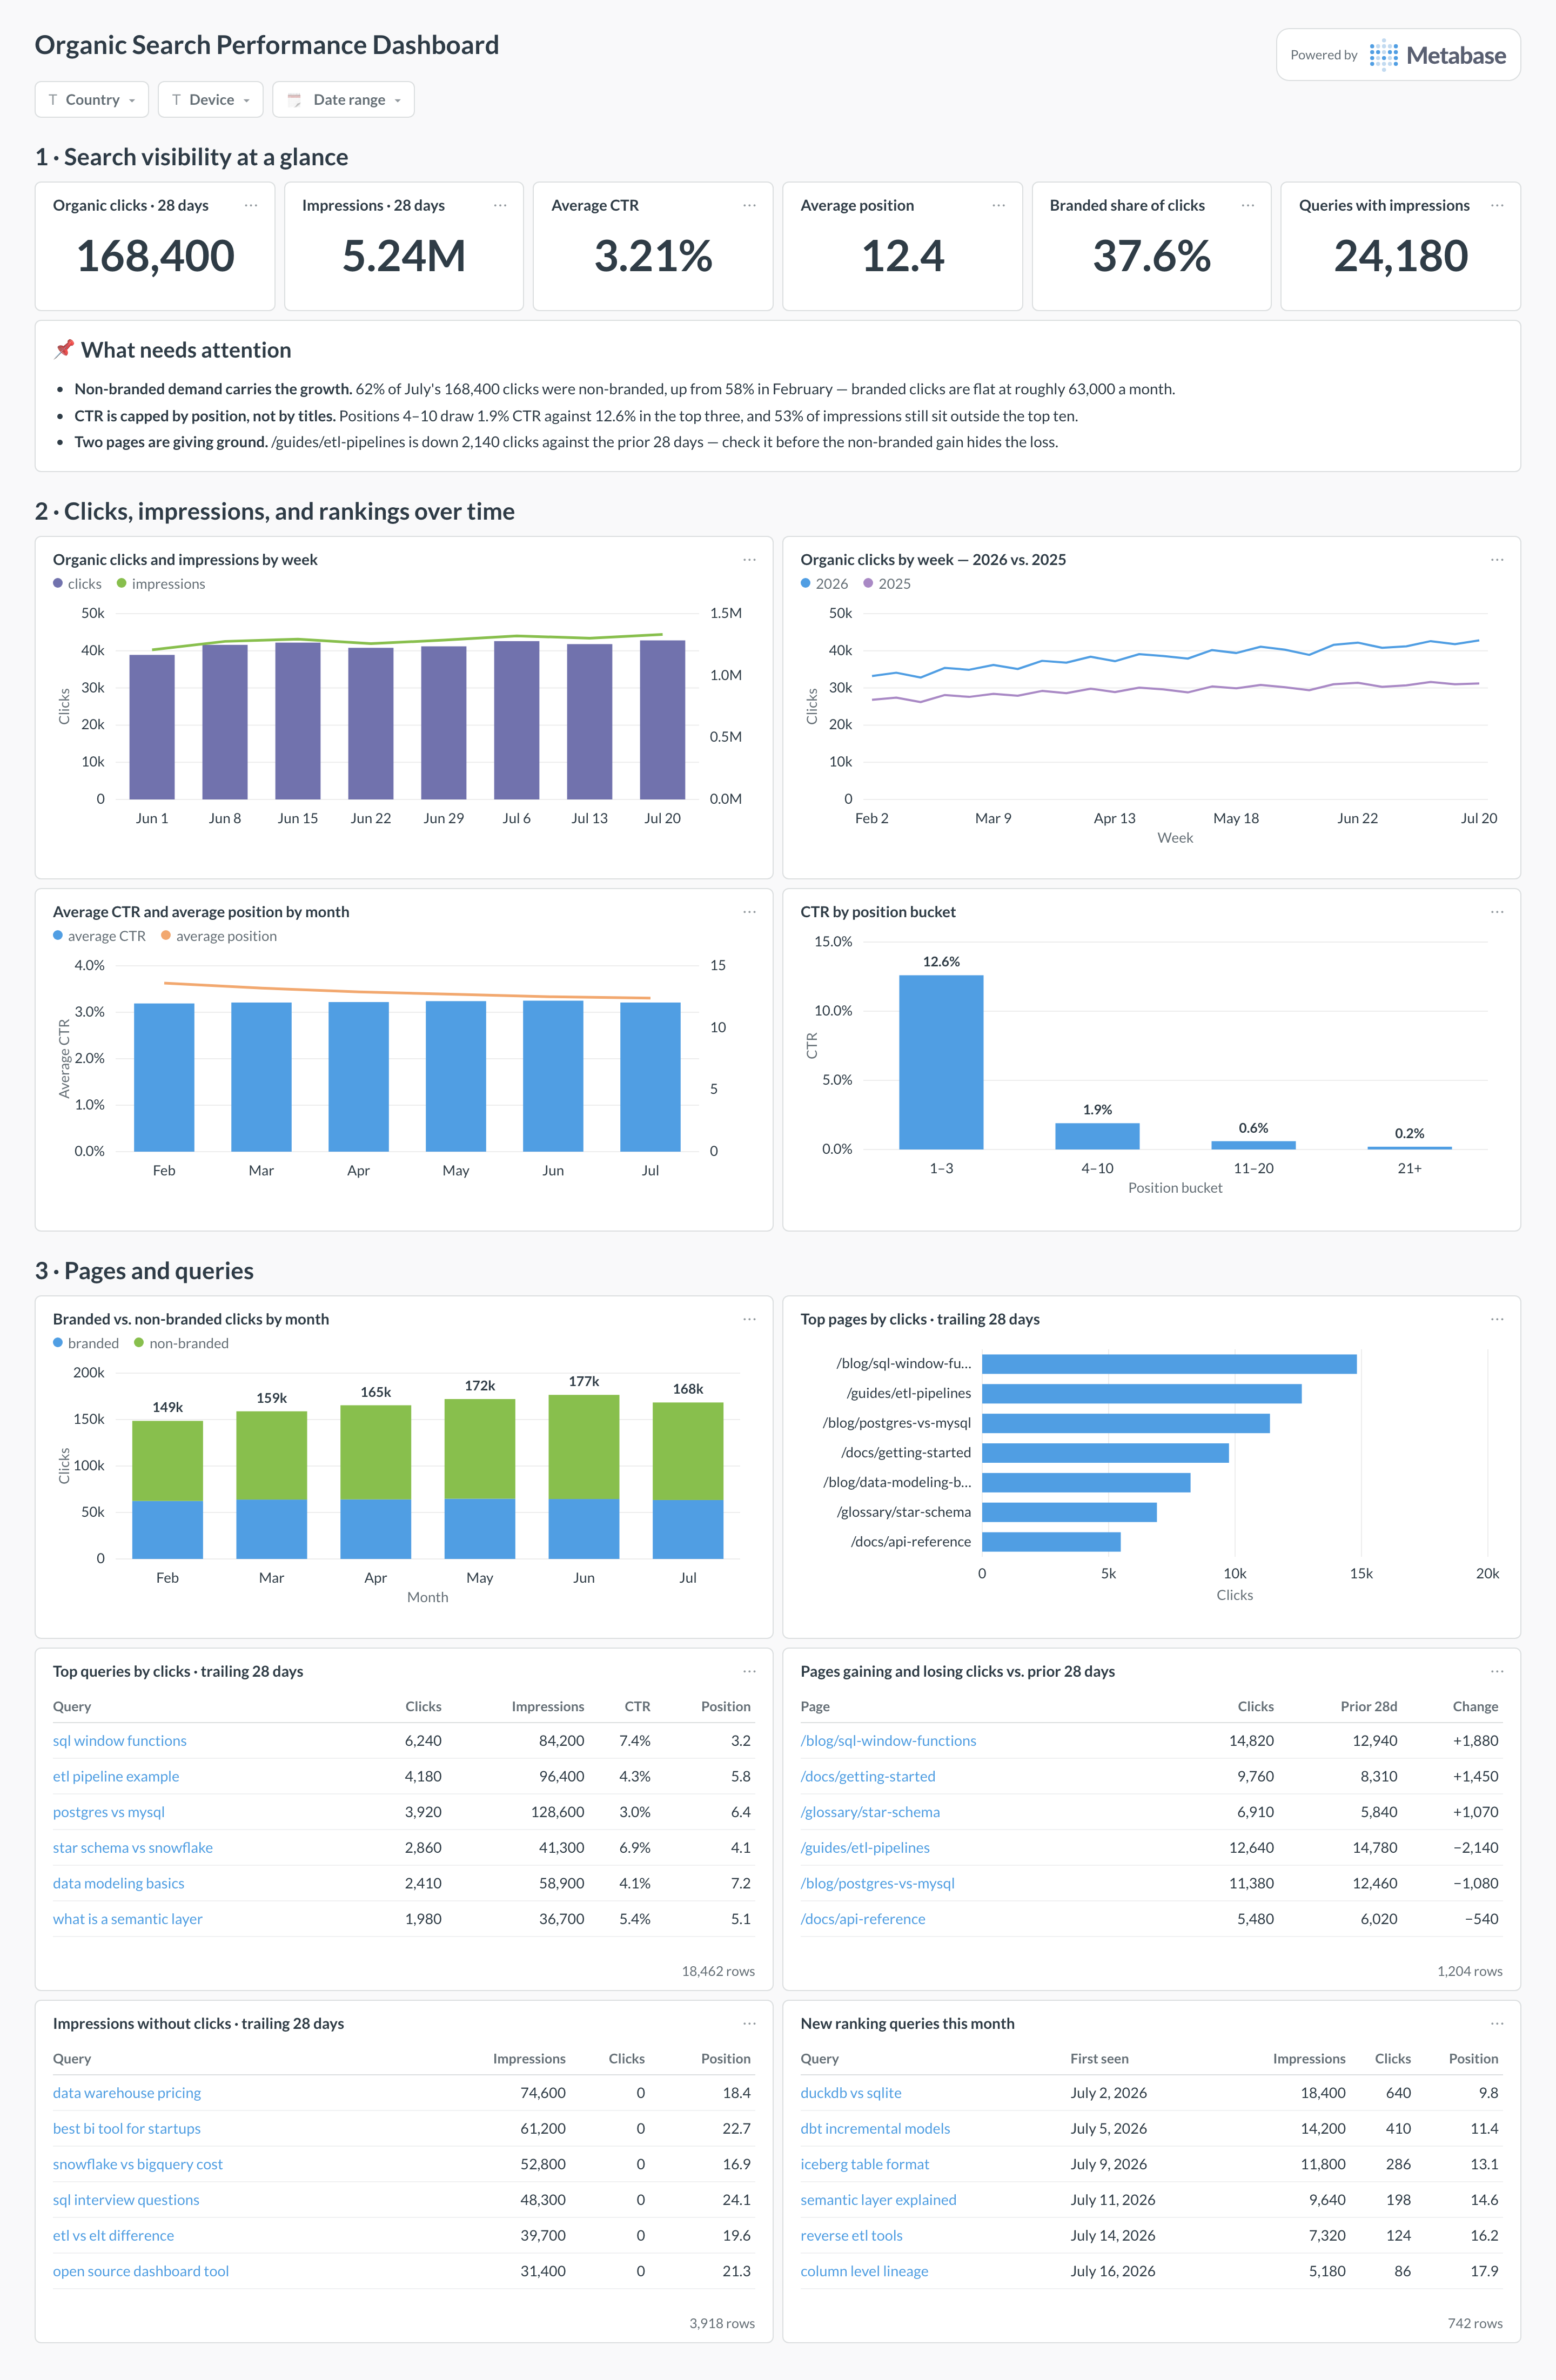
An example organic search performance dashboard in Metabase, built from Google Search Console data. Figures are illustrative.
Which cards belong on an organic search performance dashboard?
- Organic clicks and impressions by week (combo)
- Average CTR and average position trend (line)
- Top queries by clicks, trailing 28 days (table)
- Pages gaining and losing clicks vs. the prior period (table)
- Branded vs. non-branded clicks (stacked bar)
- CTR by position bucket — 1–3, 4–10, 11+ (bar)
- Impressions without clicks — high-visibility, zero-traffic queries (table)
- New ranking queries this month (table)
What data does the dashboard need?
gsc_performance_dailyat query, page, country, and device grain — clicks, impressions, CTR, and position per row.- A query classification table with an
is_brandedflag, so branded and non-branded cards stay consistent everywhere. - Optional page metadata — content type, publish date, owning team — for slicing winners and losers by section.
For high-volume sites, Search Console’s native bulk export to BigQuery is the best route — unsampled daily rows, no API row caps. Either way, the API only reaches back 16 months, so start the sync well before you need the history.
How do you build it?
- Sync Search Console data to a warehouse — via the bulk BigQuery export or an API-based connector (see the Search Console guide for routes).
- Build the branded classification table and join it to the daily performance data in a view or model.
- Compute weekly rollups with impression-weighted average position, and period-over-period deltas for the winners/losers tables.
- Assemble the cards with country and device filters, and drill-throughs from page rows to their query-level detail.
Example card SQL
SELECT
date_trunc('week', stat_date) AS week,
SUM(clicks) AS clicks,
SUM(impressions) AS impressions,
ROUND(
  100.0 * SUM(clicks) / NULLIF(SUM(impressions), 0), 2
) AS ctr_pct,
ROUND(
  SUM(position * impressions) / NULLIF(SUM(impressions), 0), 1
) AS avg_position
FROM gsc_performance_daily
GROUP BY 1
ORDER BY 1;