What are organic clicks and impressions, and how do you measure them in Metabase?
Organic clicks and impressions are the raw material of search
performance: how often your pages appear in Google results, and how often searchers
choose them. They come from Google Search Console performance rows at a query × page × day grain — which, synced into a warehouse,
turns Search Console's 16-month window into permanent history you can query in
Metabase.
TL;DR — Sync GSC early: the API serves a rolling 16-month window, and history beyond it exists only if you stored it. Split branded from
non-branded, read impressions with position and CTR, and don't expect
query-level rows to sum to property totals — anonymized queries are omitted.
What does an organic traffic chart look like in Metabase?
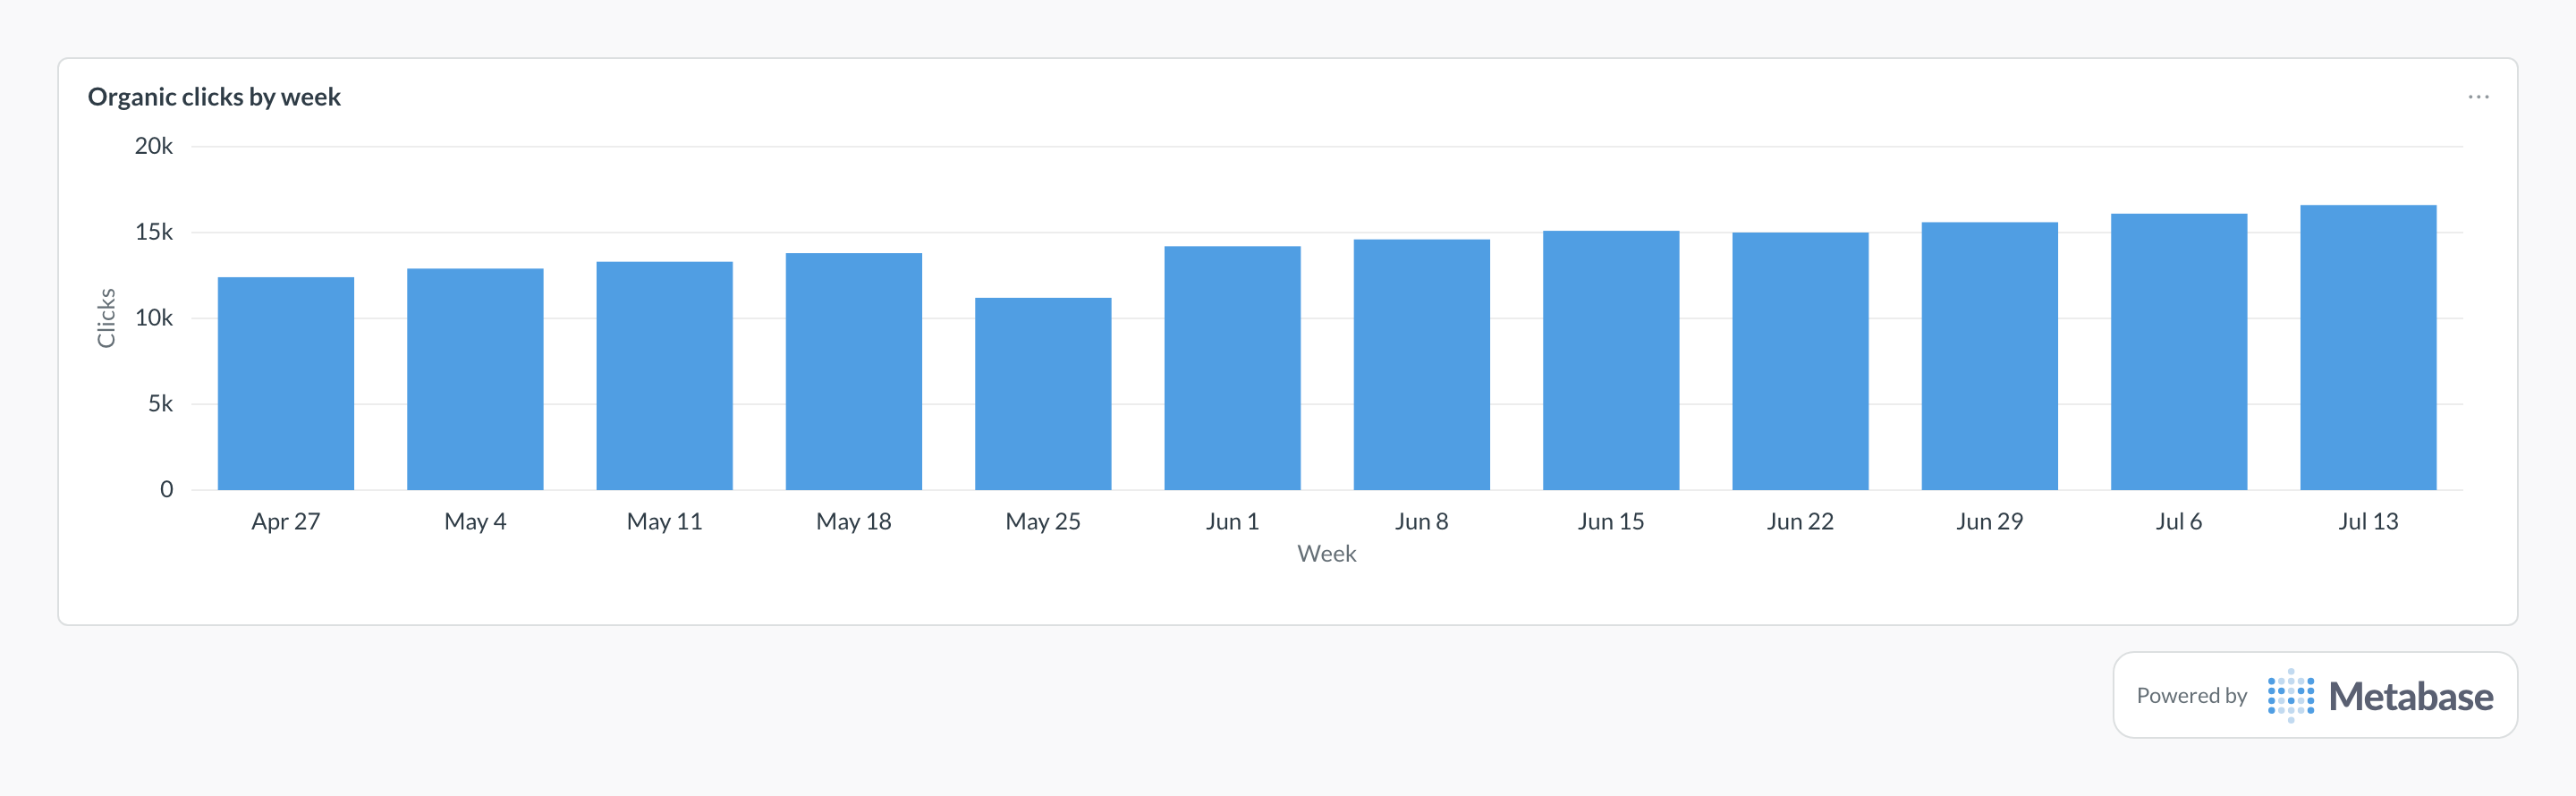
Chart clicks per week as bars and judge the staircase, not any single bar —
the climb from around 12k to 16k is compounding content and ranking work. A
one-week dip like May 25's is usually the calendar, a holiday week when
search demand sags everywhere; check whether impressions dipped the same
week before treating it as a ranking loss.
Organic clicks as a Metabase card, built from synced Search Console data.
Figures are illustrative.
What organic clicks and impressions measure
Impressions measure visibility — Google considered your page relevant enough
to show. Clicks measure relevance — the searcher agreed. The gap between
them, read through average position and CTR, tells you which lever to pull: low position means a rankings problem,
good position with weak CTR means a title-and-snippet problem.
The split that makes the trend honest is branded vs. non-branded. Branded
queries track brand strength; non-branded queries track SEO. Mixed together,
one can silently cover for the other for quarters at a time.
What data does it need?
A gsc_performance_daily table with query, page, stat_date, clicks, impressions,
and position, synced daily from the Search Console API.
A small gsc_query_classification table with an is_branded flag per query, maintained by hand or by rule.
Optionally, sessions from your web analytics tool to follow organic
visitors past the click — GSC stops at the SERP.
SQL patterns
Clicks, impressions, CTR, and position by weekPostgreSQL
SELECT
  date_trunc('week', stat_date) AS week,
  SUM(clicks) AS clicks,
  SUM(impressions) AS impressions,
  ROUND(100.0 * SUM(clicks) / NULLIF(SUM(impressions), 0), 2) AS ctr_pct,
  ROUND(
    SUM(position * impressions) / NULLIF(SUM(impressions), 0), 1
  ) AS avg_position
FROM gsc_performance_daily
WHERE stat_date >= CURRENT_DATE - INTERVAL '12 months'
GROUP BY 1
ORDER BY 1;
Branded vs. non-branded clicks by monthPostgreSQL
SELECT
  date_trunc('month', g.stat_date) AS month,
  CASE
    WHEN COALESCE(c.is_branded, false) THEN 'branded'
    ELSE 'non-branded'
  END AS query_type,
  SUM(g.clicks) AS clicks,
  SUM(g.impressions) AS impressions
FROM gsc_performance_daily g
LEFT JOIN gsc_query_classification c
  ON g.query = c.query
WHERE g.stat_date >= CURRENT_DATE - INTERVAL '12 months'
GROUP BY 1, 2
ORDER BY 1, 2;
Pitfalls
Letting the 16-month window expire before syncing.→
Search Console history you didn't store is unrecoverable. Start the sync
before you need the history — the year-over-year chart you'll want next year
requires rows the API stops serving in sixteen months.
Summing query-level rows and expecting property totals.→
Google omits anonymized (rare or privacy-filtered) queries from query-level
data, so query rows sum to less than the property total — often 20% less or
more. Trend each grain against itself; never reconcile across grains.
Chasing impressions without CTR.→
Impressions rise whenever Google tests your pages on marginal queries —
including ones you'll never win. Impression growth with flat clicks and
sliding CTR is noise, not progress. Celebrate clicks; audit impressions.
Treating average position as a ranking guarantee.→
Position is an impression-weighted average across queries, devices, and
personalized results — position 6.2 doesn't mean you're sixth for anything.
Use it directionally per query, never as a rank tracker.
Where do organic clicks and impressions come from?
From Google Search Console performance data, which reports clicks, impressions, CTR, and average position at a query × page × day grain. That grain is the asset: it lets you slice by query class, page section, and time in SQL instead of paging through the Search Console UI. Sync it into a warehouse and the same rows power a full organic search performance dashboard.
How far back does Search Console data go?
The API serves a rolling 16-month window — data older than that is gone from Google's side, permanently. That makes syncing early the single highest-leverage move: start the Search Console sync now and your warehouse accumulates history the API can no longer serve. Year-over-year comparisons, three-year content trends, and pre/post-migration analyses all depend on history you can only build by having started before you needed it.
Why split branded from non-branded queries?
Because they measure different things. Branded clicks (people searching your name) reflect brand strength — driven by product, PR, and word of mouth, not your SEO work. Non-branded clicks reflect actual search-acquisition performance. A traffic chart that mixes them lets brand growth mask SEO decline, or vice versa. Maintain a small classification table of branded patterns and join it in SQL; the branded share of total clicks is itself a metric worth trending.
What do impressions without clicks mean?
Visibility without relevance — Google shows the page, searchers don't choose it. Read impressions with average position and CTR before diagnosing: high impressions at position 45 is a rankings problem (the impression may be page five, technically "shown"); high impressions at position 4 with a weak CTR is a title-and-snippet problem. Rising impressions at improving positions is usually the leading indicator that clicks are coming.
How do you track organic search performance in Metabase?
Sync Search Console performance rows into a SQL database on a daily schedule, then chart weekly clicks, impressions, CTR, and position, with a branded/non-branded split by month. Join against sessions from Google Analytics 4 or Plausible to follow organic visitors past the click — GSC ends at the click; conversion lives in your analytics data. Pin the result next to paid traffic on a paid vs. organic mix dashboard.