





What is cost per lead, and how do you measure it in Metabase?
Cost per lead is spend divided by leads (or other target actions) generated — the efficiency metric for the top of a lead-gen funnel. It sits between CPC, which prices attention, and CAC, which prices actual customers. Measure it in Metabase from spend and lead data synced from LinkedIn Ads, Google Ads, and Meta Ads.
spend ÷ leads, per channel and
campaign, always paired with cost per qualified lead. CPL falling while
qualified-lead cost rises means quality dropped — the classic failure mode of
optimizing on CPL alone.
What does a cost per lead chart look like in Metabase?
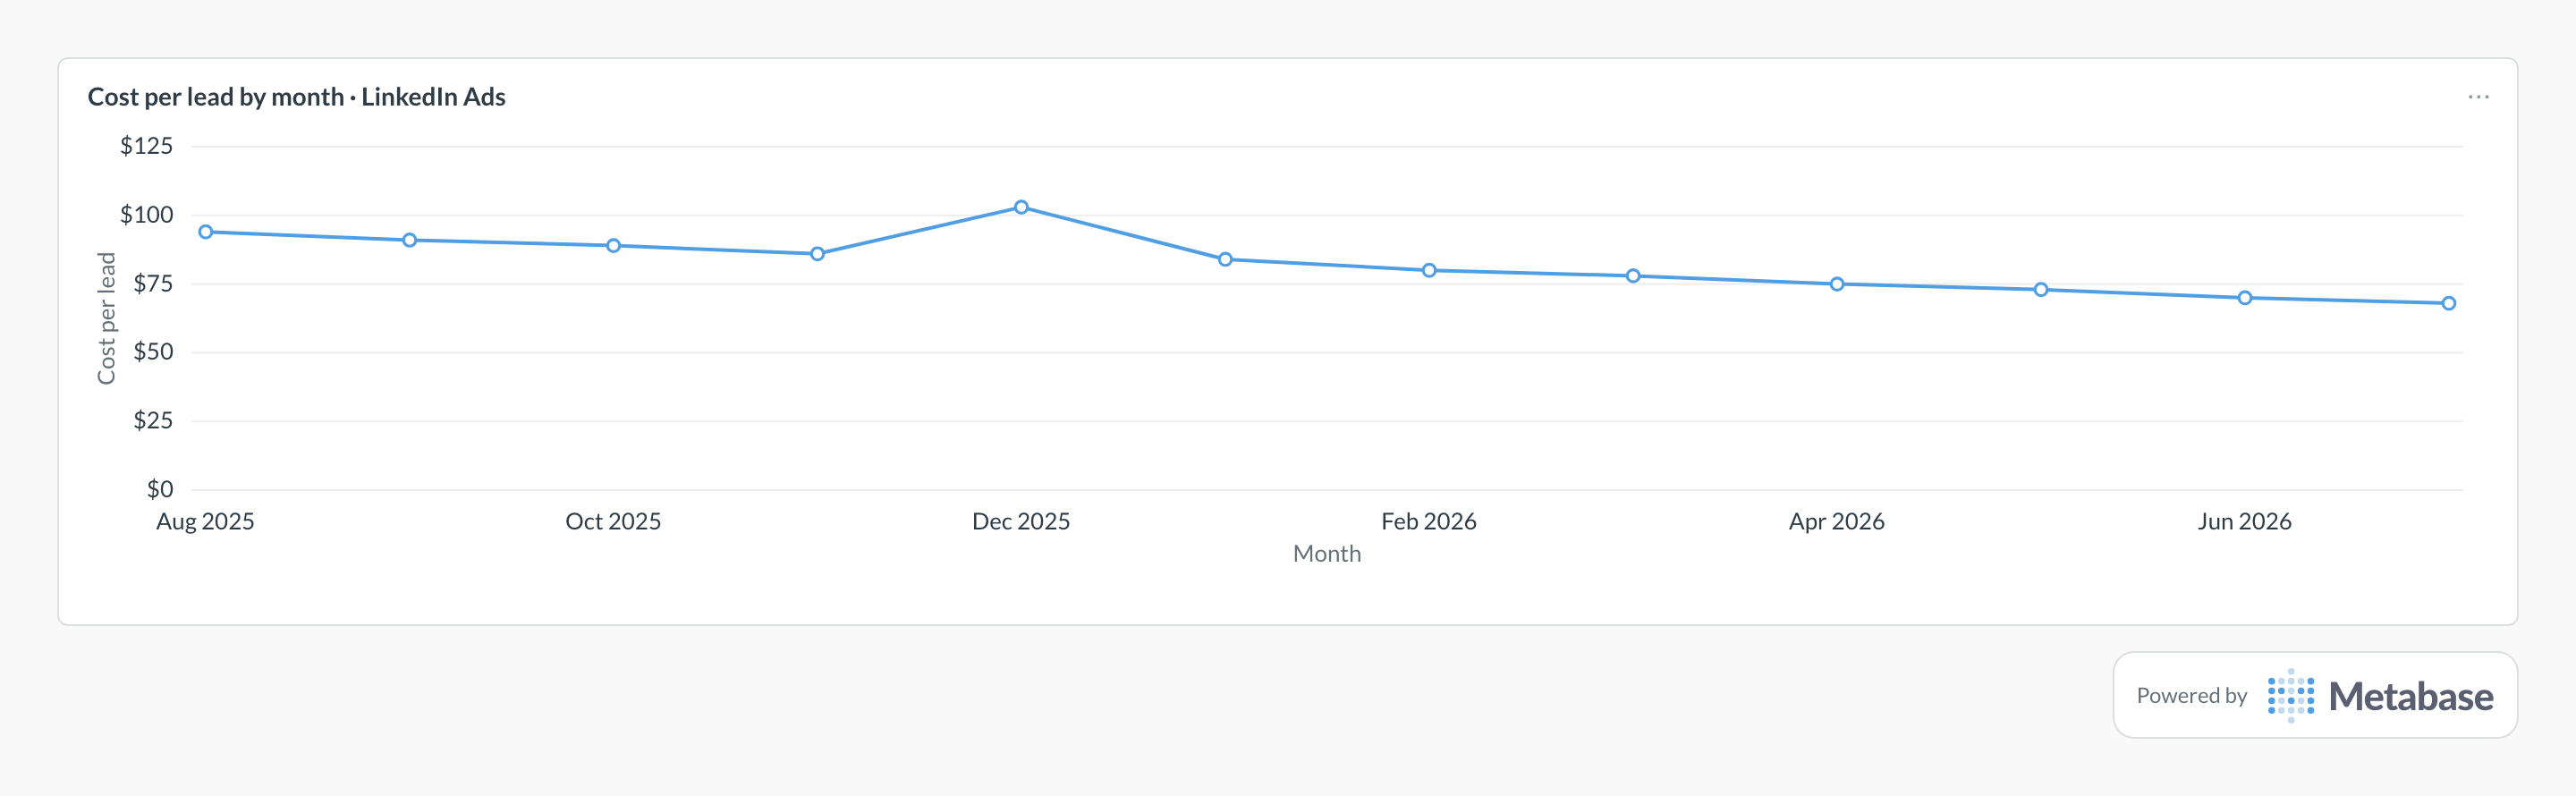
Chart spend divided by leads by month, one line per channel, and read the drift: the slide from the mid-$90s to under $70 is targeting and creative iteration compounding. An isolated spike like Dec 2025's is usually auction pressure — holiday CPMs inflate every bid — so check impression costs for that month before concluding the campaign broke.
What cost per lead measures
It measures how efficiently a channel converts budget into hand-raisers. That makes it the right metric for comparing campaigns within a channel and for spotting creative or audience decay early — lead volume reacts faster than revenue does. It is the wrong metric to optimize in isolation, because platforms will happily deliver cheaper leads by finding people who fill in forms but never buy.
Raw leads vs. qualified leads
A raw lead is a form fill; a qualified lead (MQL or SQL, by whatever your team's definition is) is one that survived a quality check. The two costs move independently: broaden targeting and CPL falls while cost per qualified lead rises, because the extra leads are noise. LinkedIn Lead Gen Forms are the canonical example — prefilled forms make submitting nearly frictionless, so raw volume is high and the qualification step does the real filtering. Connect CPL to downstream conversion so cheap-but-bad channels get caught instead of rewarded.
What data does it need?
-
An
ad_performance_dailytable withchannel,stat_date,spend, andleadsas each platform reports them. -
A CRM
leadstable withsource_channel,created_at, and anis_qualifiedflag — one lead definition applied to every channel.
SQL patterns
SELECT
  channel,
  date_trunc('month', stat_date) AS month,
  SUM(spend) AS spend,
  SUM(leads) AS leads,
  ROUND(SUM(spend) / NULLIF(SUM(leads), 0), 2) AS cost_per_lead
FROM ad_performance_daily
WHERE stat_date >= CURRENT_DATE - INTERVAL '12 months'
GROUP BY 1, 2
ORDER BY 2, 1;WITH monthly_spend AS (
SELECT
channel,
date_trunc('month', stat_date) AS month,
SUM(spend) AS spend
FROM ad_performance_daily
GROUP BY 1, 2
),
lead_counts AS (
SELECT
source_channel AS channel,
date_trunc('month', created_at) AS month,
COUNT(*) AS leads,
COUNT(*) FILTER (WHERE is_qualified) AS qualified_leads
FROM leads
GROUP BY 1, 2
)
SELECT
s.month,
s.channel,
ROUND(s.spend / NULLIF(l.leads, 0), 2) AS cost_per_lead,
ROUND(s.spend / NULLIF(l.qualified_leads, 0), 2)
AS cost_per_qualified_lead,
ROUND(100.0 * l.qualified_leads / NULLIF(l.leads, 0), 1)
AS qualification_rate_pct
FROM monthly_spend s
JOIN lead_counts l
ON l.channel = s.channel AND l.month = s.month
ORDER BY 1, 2;Pitfalls
Where this metric applies
- LinkedIn Ads + Metabase — Lead Gen Form leads and campaign spend
- Google Ads + Metabase — lead form extensions and conversion actions
- Meta Ads + Metabase — instant form leads by campaign
Related
Metrics
Dashboards
Terms
FAQ
Cost per lead vs. cost per acquisition — what's the difference?
What's a good cost per lead?
Why is our CPL falling but pipeline shrinking?
How do you calculate cost per lead?
SUM(spend) / COUNT(leads), per channel and month, with NULLIF guarding zero-lead periods. The load-bearing decision is what counts as a lead — write one definition (which form fills, which events, deduplicated how) and apply it identically to every channel, or the comparison is between definitions rather than channels.How do you track cost per lead in Metabase?
ad_performance_daily table, and land your CRM leads with a qualified flag. Chart CPL and cost per qualified lead side by side, and pin them on a paid channel performance dashboard next to landing page conversion rate.