





What does a product retention dashboard show in Metabase?
A product retention dashboard shows whether users who sign up actually stay: activation, cohort retention, stickiness, and growth accounting, computed from product events synced from tools like Amplitude, PostHog, and Mixpanel. In the warehouse, the same math joins to acquisition data — so growth teams can see which channels send users who stick, not just which send signups.
For: growth and product teams, product managers, and founders. Grain: one row per user per active day (daily event rollups), plus one row per user with signup, activation, and channel.
What does a product retention dashboard look like?
Here’s the layout this guide builds: activation and engagement headlines at the top, then active-user trends, stickiness, growth accounting, and time to first value, then the cohort tables — weekly retention, retention by acquisition channel, and feature adoption by cohort.
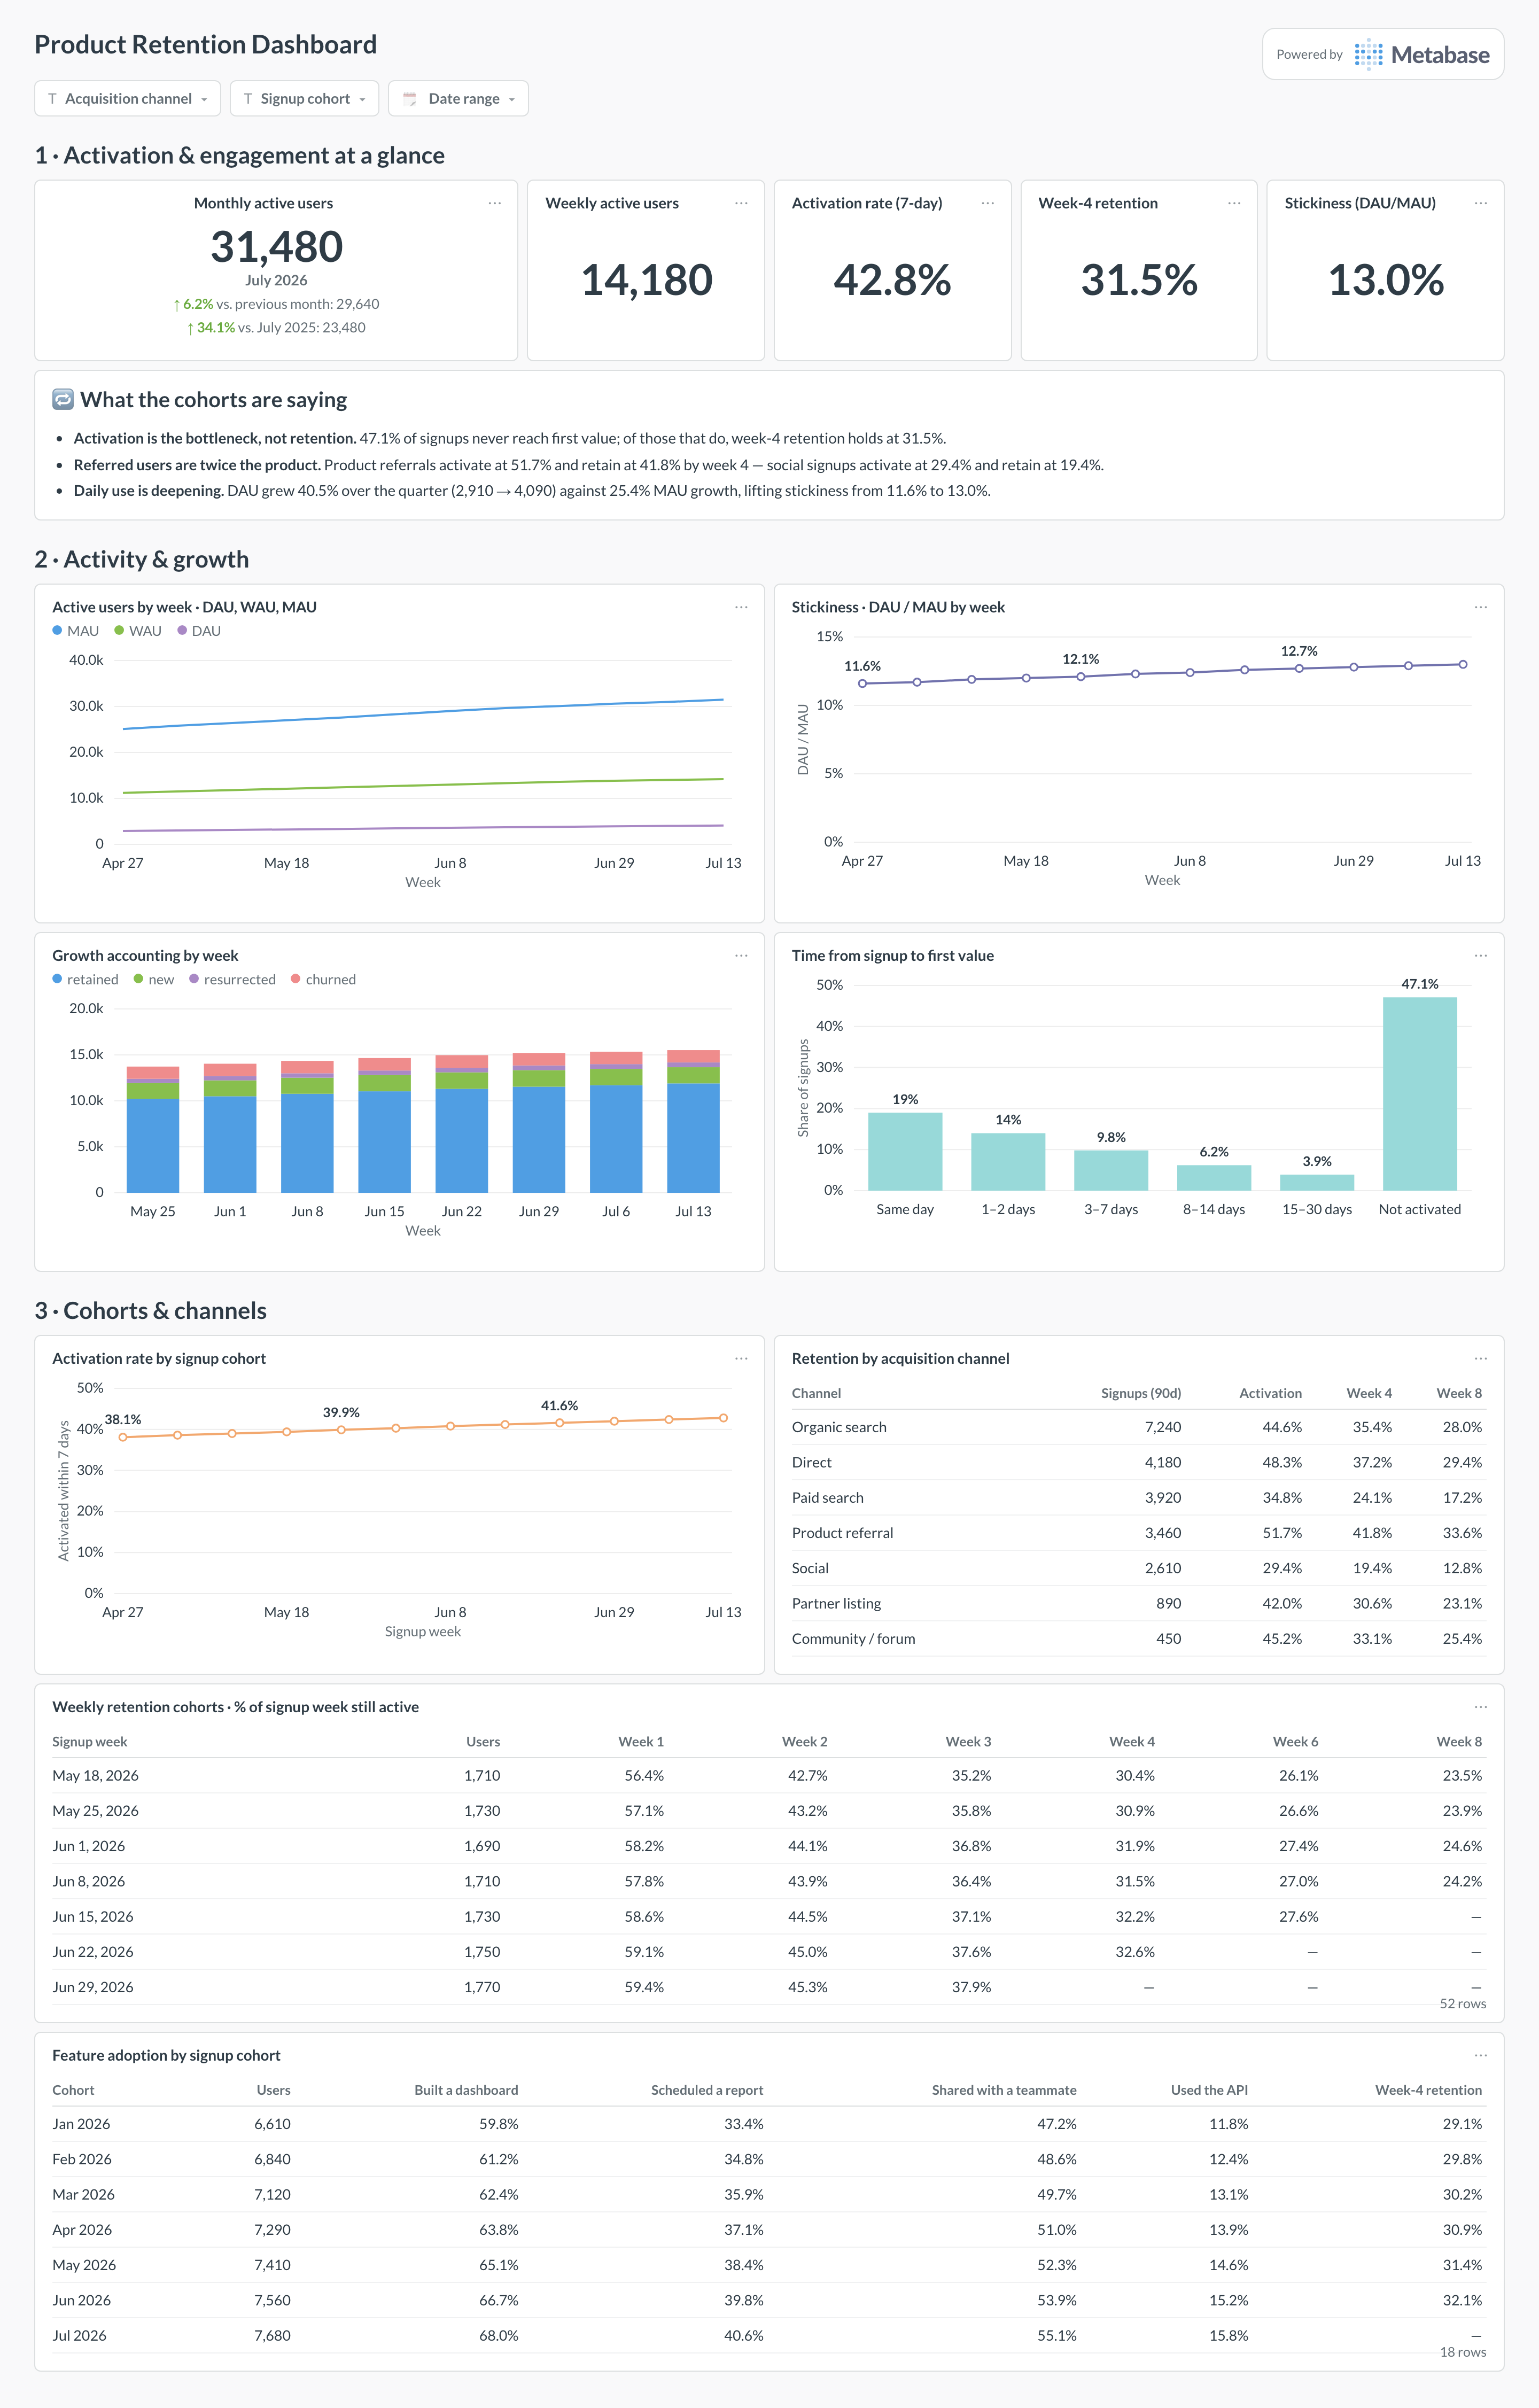
An example product retention dashboard in Metabase, built from event data synced from Amplitude, PostHog, or Mixpanel. Figures are illustrative.
Which cards belong on a product retention dashboard?
- Weekly retention cohorts — signup week × weeks since signup (heatmap-style table)
- Activation rate by signup cohort (line)
- DAU, WAU, and MAU (line)
- Stickiness — DAU/MAU ratio (line)
- Retention by acquisition channel (table)
- Growth accounting — new, retained, resurrected, and churned users per week (stacked bar)
- Time to activation — days from signup to first value (bar)
- Feature adoption by cohort (table)
What data does the dashboard need?
- A
userstable withuser_id,signup_at,activated_at, andacquisition_channel. - Daily event rollups per user —
user_daily_activitywith user, date, and event counts — built from synced product events. - Optional mobile attribution from AppsFlyer, mapping installs to channels and campaigns.
How do you build it?
- Sync event-level data to the warehouse via each tool’s native export (see the Amplitude, PostHog, and Mixpanel guides for routes).
- Resolve identities to one canonical
user_idand roll events up to a user-day table — cohort SQL gets fast and simple at that grain. - Define activation behaviorally and stamp
activated_atandacquisition_channelonto the users table. - Build the cohort table, activity trends, and growth accounting cards, with a channel filter across all of them.
Example card SQL
WITH cohorts AS (
SELECT
  user_id,
  date_trunc('week', signup_at)::date AS cohort_week
FROM users
),
cohort_sizes AS (
SELECT cohort_week, COUNT(*) AS cohort_size
FROM cohorts
GROUP BY 1
)
SELECT
c.cohort_week,
(a.activity_date - c.cohort_week) / 7 AS week_number,
ROUND(
  100.0 * COUNT(DISTINCT a.user_id) / MAX(s.cohort_size), 1
) AS retention_pct
FROM cohorts c
JOIN user_daily_activity a ON a.user_id = c.user_id
JOIN cohort_sizes s ON s.cohort_week = c.cohort_week
WHERE (a.activity_date - c.cohort_week) / 7 BETWEEN 0 AND 12
GROUP BY 1, 2
ORDER BY 1, 2;
Related
Metrics
Integrations
Dashboards
FAQ
How should activation be defined?
activated_at on the users table so activation rate means the same thing on every card. Funnel tools like Amplitude are good for discovering the moment; the warehouse is where the definition becomes governed.Why does retention need cohorts instead of an average?
How do you connect acquisition channel to retention?
acquisition_channel on the users table at signup — from UTM attribution, or from AppsFlyer for mobile installs — and group the cohort math by it. This is the card that closes the loop with marketing: some channels deliver users who churn by week two, others deliver users who stay, and blended CAC hides the difference completely. Paired with the marketing funnel dashboard, it turns budget debates into a retention-per-channel question rather than a cost-per-signup one.How do identity merges affect retention math?
user_id, time-to-activation looks longer than it is; if one person's two devices count as two users, retention undercounts. Sync the tool's identity-mapping table alongside events and resolve to a canonical user_id in a model before any cohort math runs.