





What is activation rate, and how do you measure it in Metabase?
Activation rate is the share of new signups who reach your product's value moment — created a first project, invited a teammate — within a defined window. It's the bridge metric between marketing and product: signups measure what marketing delivered, activation measures whether those users got anywhere. Measure it in Metabase from event data synced from Amplitude, PostHog, or Mixpanel.
activated_within_window / signups, per
signup cohort. Pick an activation event validated against retention, fix a
window (7 or 14 days) so cohorts compare, and segment by acquisition channel
— that's where marketing learns which channels send users who stick.
What does an activation rate chart look like in Metabase?
Chart each weekly signup cohort against the share who reached the activation event within seven days, and read the slope: the climb from about 28% to 36% is onboarding improvements compounding cohort over cohort. A single-cohort drop like May 25's usually traces to a promotion that flooded the funnel with low-intent signups — segment that week by channel before blaming the product.
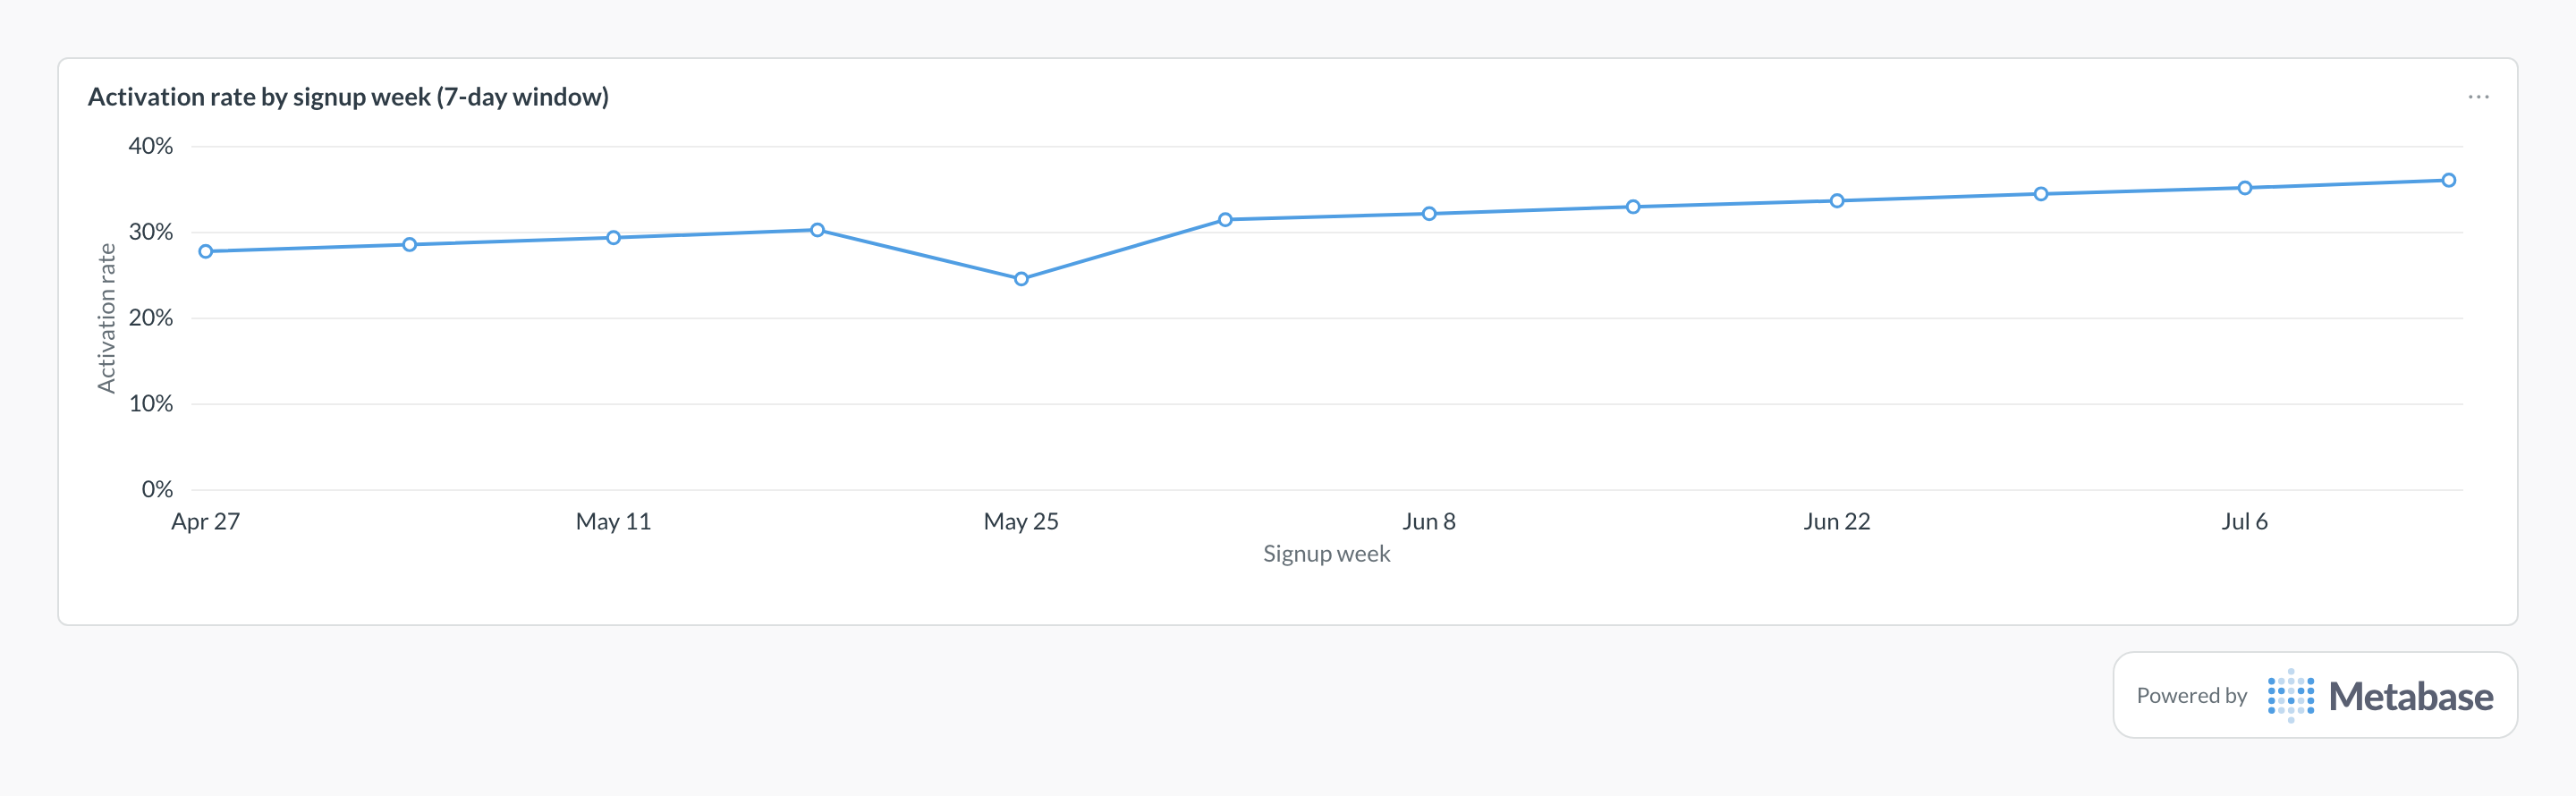
What activation rate measures
Whether new users cross from signed up to getting value — the step where most funnels quietly leak. Defined well, it's the earliest reliable predictor of retention: the activation event should be a behavior that demonstrably separates users who stay from users who churn, found by correlating early actions against retention, not chosen in a meeting. Time-in-app and session counts don't qualify — activity isn't value.
Segmented by acquisition channel, it becomes marketing's quality metric. Two channels with identical CAC and very different activation rates have very different real costs — and the channel review that includes activation stops rewarding cheap signups that go nowhere.
What data does it need?
-
A stable user ID and a
signup_attimestamp — the cohort anchor. -
An
activated_attimestamp: the first occurrence of the activation event per user, materialized from the product-events stream. - Acquisition channel on the user record, captured at signup from UTM parameters or an attribution tool.
- Identity resolution that survives the anonymous-to-identified merge, so pre-signup events attach to the right user.
SQL patterns
SELECT
  date_trunc('week', signup_at) AS signup_week,
  COUNT(*) AS signups,
  COUNT(*) FILTER (
    WHERE activated_at IS NOT NULL
      AND activated_at <= signup_at + INTERVAL '7 days'
  ) AS activated,
  ROUND(
    100.0 * COUNT(*) FILTER (
      WHERE activated_at IS NOT NULL
        AND activated_at <= signup_at + INTERVAL '7 days'
    ) / COUNT(*), 2
  ) AS activation_rate_pct
FROM users
WHERE signup_at >= CURRENT_DATE - INTERVAL '6 months'
  AND signup_at <= CURRENT_DATE - INTERVAL '7 days'
GROUP BY 1
ORDER BY 1;SELECT
acquisition_channel,
COUNT(*) AS signups,
COUNT(*) FILTER (
WHERE activated_at IS NOT NULL
AND activated_at <= signup_at + INTERVAL '7 days'
) AS activated,
ROUND(
100.0 * COUNT(*) FILTER (
WHERE activated_at IS NOT NULL
AND activated_at <= signup_at + INTERVAL '7 days'
) / COUNT(*), 2
) AS activation_rate_pct
FROM users
WHERE signup_at >= CURRENT_DATE - INTERVAL '90 days'
AND signup_at <= CURRENT_DATE - INTERVAL '7 days'
GROUP BY 1
ORDER BY signups DESC;Pitfalls
Where this metric applies
- Amplitude + Metabase — event streams and cohort exports for activation analysis
- PostHog + Metabase — product events with identity resolution
- Mixpanel + Metabase — user profiles and first-occurrence event timestamps
- AppsFlyer + Metabase — acquisition channel attribution joined to signup cohorts
Related
Metrics
Dashboards
Terms
FAQ
How do you calculate activation rate?
activated_within_7_days / signups. Three decisions define it — which behavior counts as activation, how long users get to do it, and which signup cohort you're measuring. Fix all three and hold them steady, or the trend line stops meaning anything.What should count as the activation event?
What window should activation use — 7 or 14 days?
Why segment activation by acquisition channel?
How do you track activation rate in Metabase?
signup_at, activated_at (first occurrence of the activation event), and acquisition channel from Amplitude, PostHog, or Mixpanel into a SQL database, then chart the windowed rate by weekly signup cohort and by channel. Pin it between the marketing funnel and the product retention dashboard — it's the metric that connects them.