





What is ROAS, and how do you measure it in Metabase?
ROAS — return on ad spend — is conversion value divided by ad spend, per campaign, channel, or period. It's the efficiency read for paid media: CAC tells you what a customer costs, ROAS tells you what a dollar of ads brings back. Measure it in Metabase from daily performance data synced from Google Ads, Meta Ads, and the rest of your paid stack.
conversion_value ÷ spend, segmented by
campaign objective. Platform-reported ROAS is directional, not truth: every
platform attributes under its own model. Breakeven depends on your margin,
not a universal 4x.
What does a ROAS chart look like in Metabase?
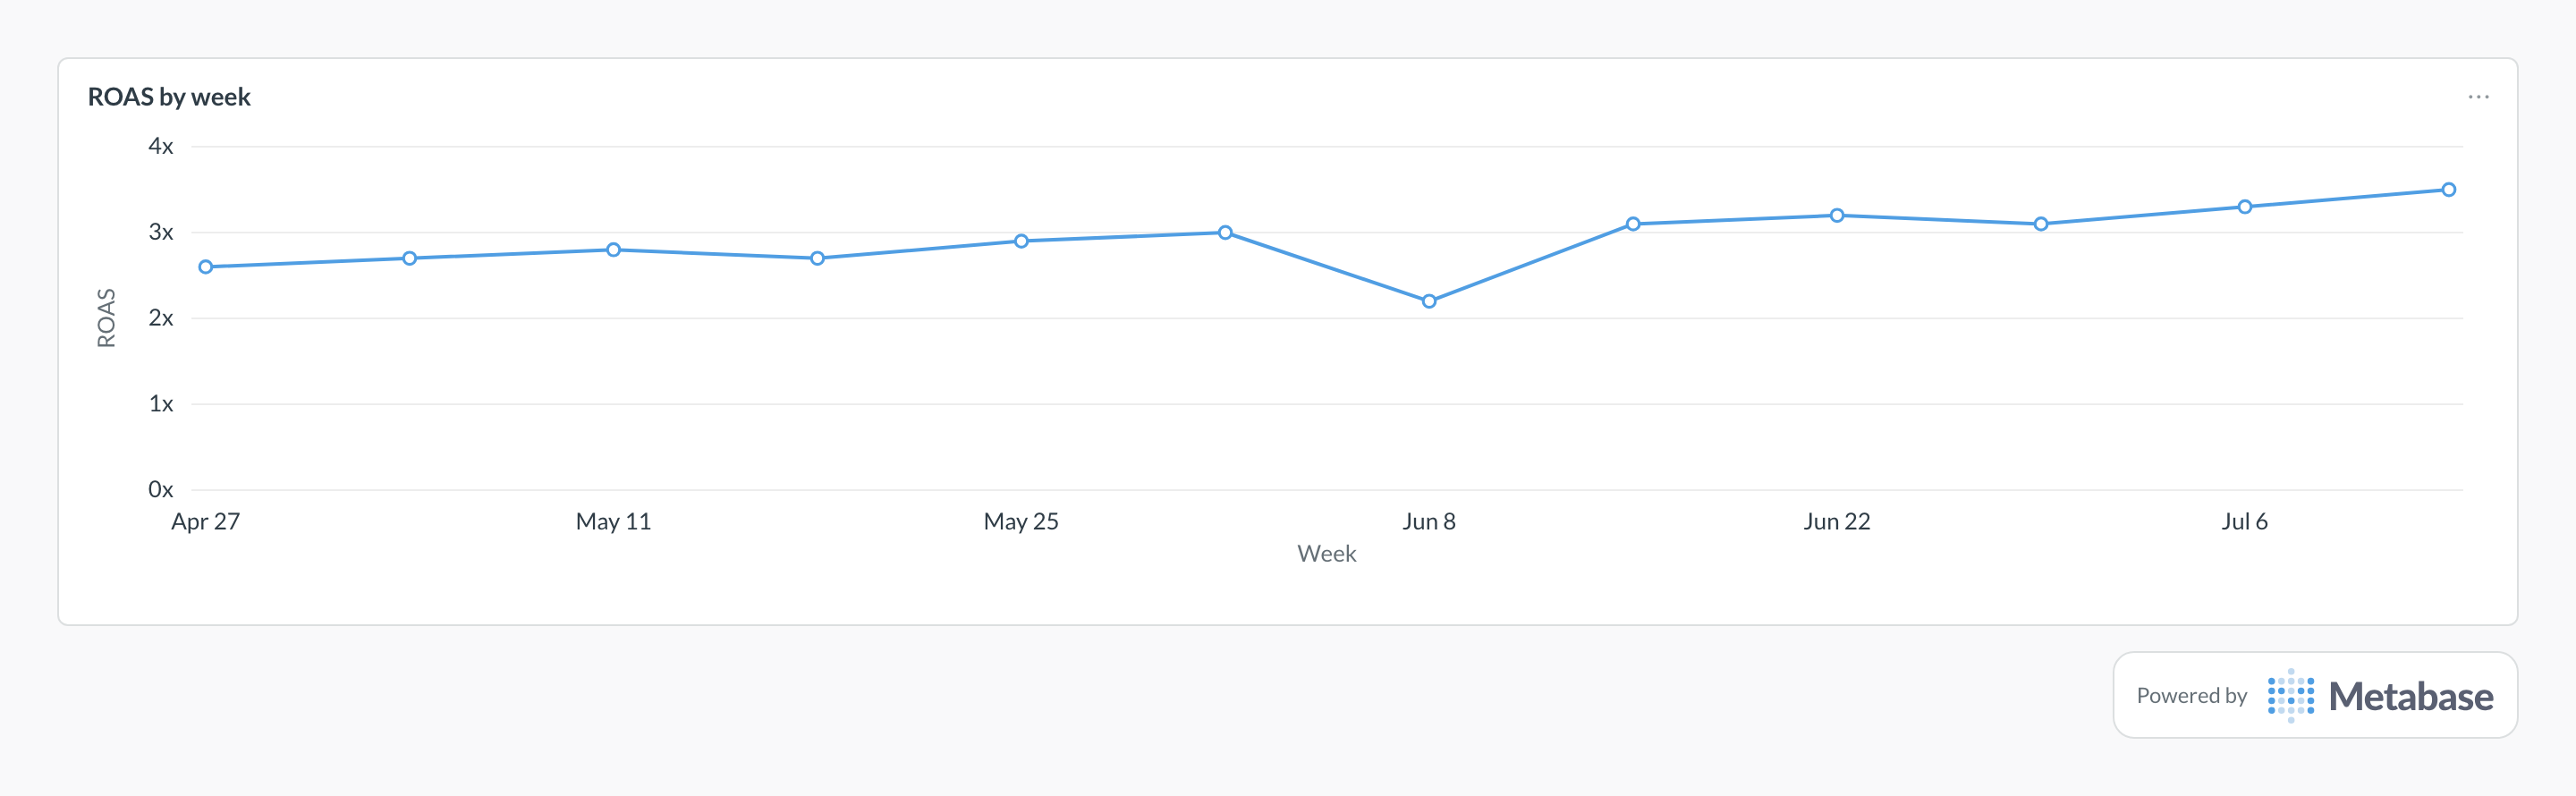
Chart conversion value ÷ spend by week and judge it against your own breakeven line, not a universal 4x — the climb from 2.6x toward 3.5x is creative and bid optimization compounding. A one-week dip like Jun 8's usually marks a deliberate efficiency trade, such as a broad prospecting audience test, and matters only if it lingers after the test ends.
What ROAS measures
It measures how much conversion value a unit of spend generates, which makes it the day-to-day steering metric for budget allocation within a channel. It does not measure profit — a 5x ROAS on a 15% margin product loses money — and it does not measure incrementality, because the platform reporting the number also grades its own homework. Segment it by campaign objective: prospecting, retargeting, and brand campaigns play different roles and should be judged against different bars.
ROAS vs. MER
Per-platform ROAS answers "which campaign should get the next dollar?" Blended MER — total revenue ÷ total marketing spend — answers "is the whole program working?" Because each platform self-reports conversions under its own attribution window, summed platform ROAS routinely exceeds what your revenue table can support. The fix isn't picking a winner; it's charting both and treating a widening gap as the signal that platforms are double-claiming conversions.
What data does it need?
-
An
ad_performance_dailytable withcampaign_name,channel,stat_date,spend, andconversion_value, unioned across platforms. -
An
orders(or revenue) table for the blended MER comparison — the one number no ad platform can inflate.
SQL patterns
SELECT
  campaign_name,
  date_trunc('week', stat_date) AS week,
  SUM(spend) AS spend,
  SUM(conversion_value) AS conversion_value,
  ROUND(SUM(conversion_value) / NULLIF(SUM(spend), 0), 2) AS roas
FROM ad_performance_daily
WHERE stat_date >= CURRENT_DATE - INTERVAL '90 days'
GROUP BY 1, 2
ORDER BY 2, 1;WITH channel_spend AS (
SELECT
channel,
date_trunc('month', stat_date) AS month,
SUM(spend) AS spend,
SUM(conversion_value) AS platform_conversion_value
FROM ad_performance_daily
GROUP BY 1, 2
),
blended_revenue AS (
SELECT
date_trunc('month', order_date) AS month,
SUM(order_total) AS revenue
FROM orders
GROUP BY 1
)
SELECT
c.month,
c.channel,
ROUND(c.platform_conversion_value / NULLIF(c.spend, 0), 2)
AS platform_roas,
ROUND(
r.revenue / NULLIF(SUM(c.spend) OVER (PARTITION BY c.month), 0),
2
) AS blended_mer
FROM channel_spend c
JOIN blended_revenue r ON r.month = c.month
ORDER BY 1, 2;Pitfalls
Where this metric applies
- Google Ads + Metabase — campaign spend and conversion value reports
- Meta Ads + Metabase — ad set performance with attributed purchase value
- TikTok Ads + Metabase — campaign-level spend and conversions
- LinkedIn Ads + Metabase — B2B campaign spend and conversion tracking
Related
Metrics
Dashboards
Terms
FAQ
ROAS vs. MER — what's the difference?
What's a good ROAS?
Why doesn't platform ROAS match my revenue data?
How do you calculate ROAS?
SUM(conversion_value) / SUM(spend), grouped by campaign, channel, or period. Guard the denominator with NULLIF so paused campaigns don't divide by zero. Decide up front whether the numerator is revenue or gross profit — revenue ROAS flatters low-margin products, so profit ROAS is the version worth ranking campaigns on.How do you track ROAS in Metabase?
ad_performance_daily table, then chart ROAS by campaign and week. Join to your revenue table for the blended MER line, and pin both next to ad spend pacing so efficiency and budget burn read together.