Quick links:
Dashboards group questions and present them on a single page. You can think of dashboards as shareable reports that feature a set of related questions. You can set up subscriptions to dashboards via email or Slack to receive the exported results of the dashboard’s questions.
A dashboard comprises a set of cards arranged on a grid. These cards can be questions - such as tables, charts, or maps - or they can be text boxes.
You can add filter widgets to dashboards that filter data identically across multiple questions, and customize what happens when people click on a chart or a table.
You can make as many dashboards as you want. Go nuts.
In the top right of the screen, click the + icon to open the Create menu, and select New Dashboard. Give your new dashboard a name and a description, choose which collections the dashboard should go in, then click Create, and Metabase will take you to your shiny new dashboard.

If you don’t want to build a dashboard from scratch, or want to experiment by making changes to an existing dashboard without affecting the original, you can duplicate an existing dashboard. From an existing dashboard, click on the … menu in the upper right, and select Duplicate.
There are two ways to add questions to a dashboard: from the dashboard, or from the question you want to add.
From a question: you can add a newly saved question to a dashboard directly from the window that pops up after you save the question for the first time. You can also add a question to a dashboard by clicking on the pencil icon next to the name of the question, and selecting Add to dashboard.
From a dashboard: Click on the pencil icon to edit the dashboard. Then click the + icon in the top right of the dashboard editing interface (not the + in the main navigation bar) to add any of your saved questions to the dashboard, regardless of which collection the questions are in.
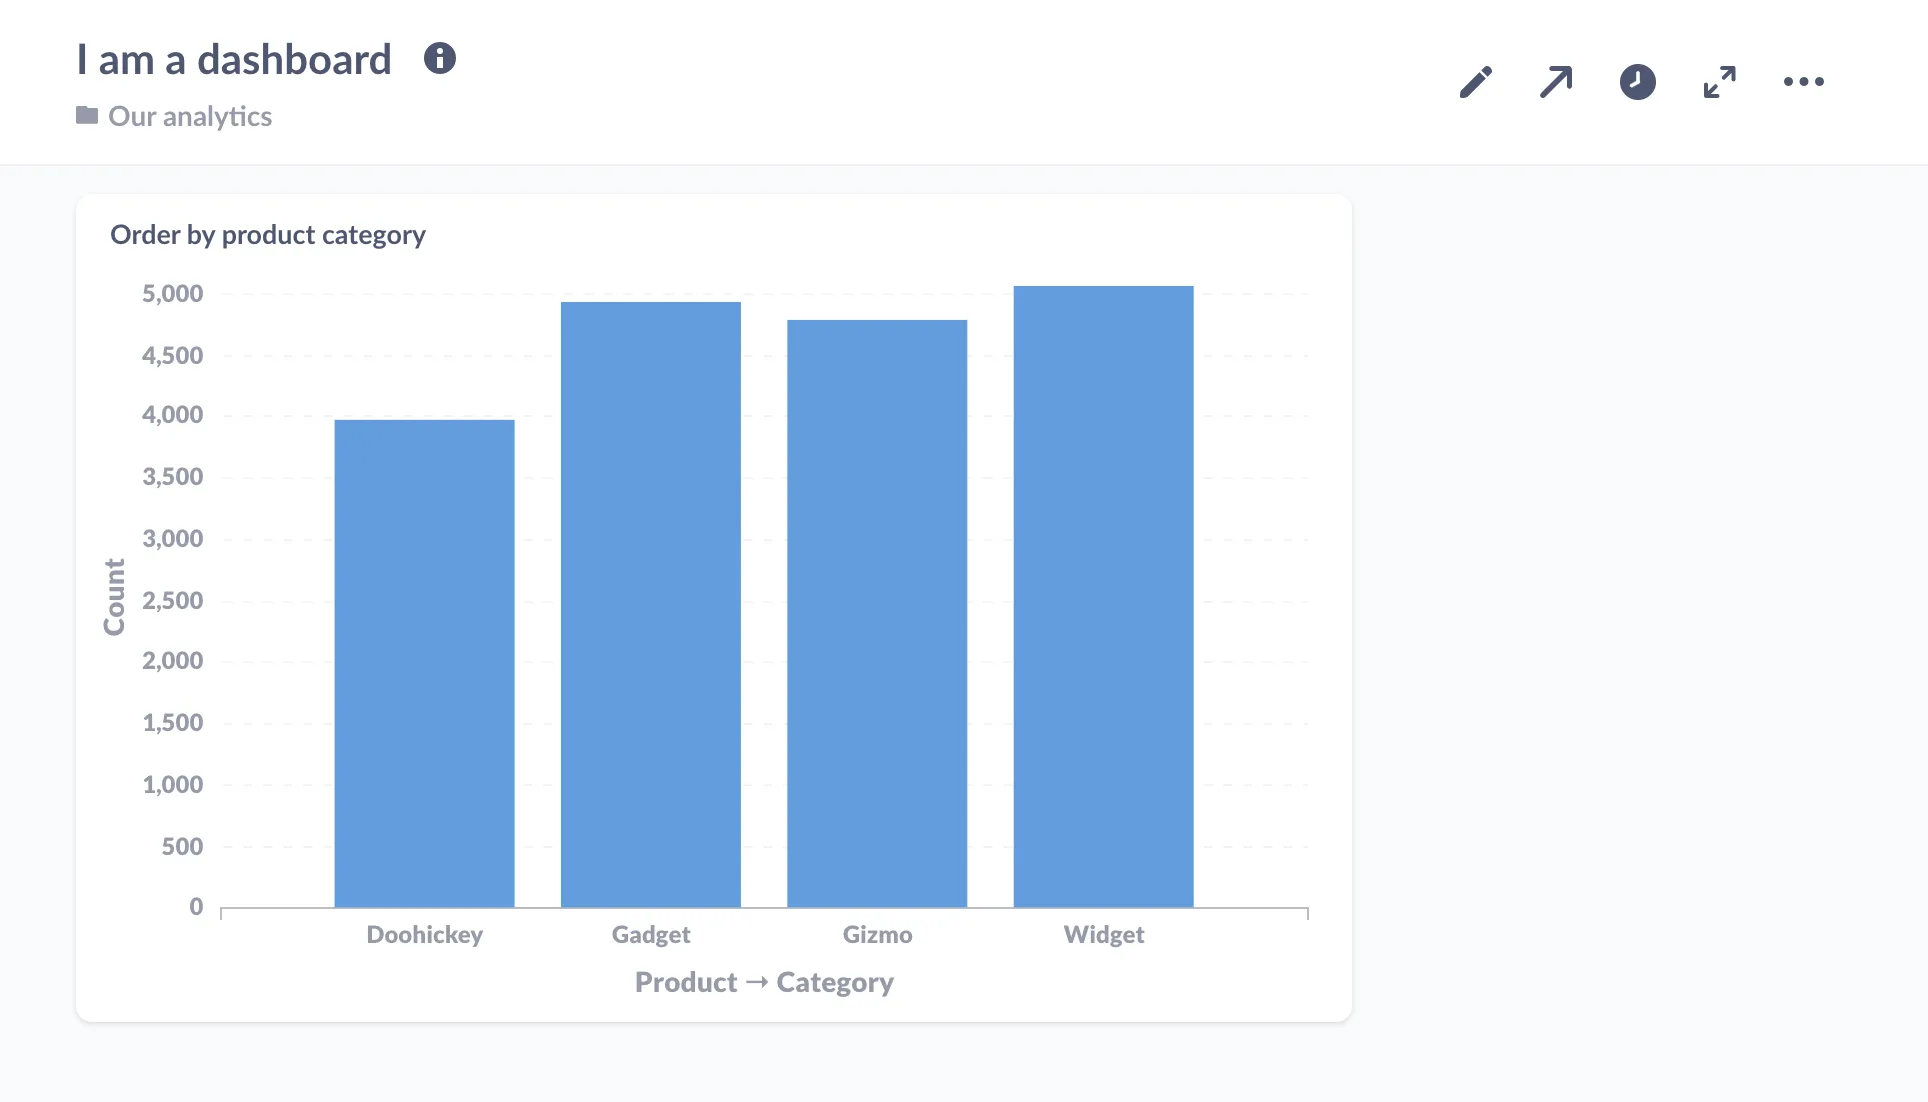
Once you add a question to your dashboard, it’ll look something like this:
Another neat thing you can do is add text cards to your dashboards. Text cards allow you to include descriptions, explanations, notes, or even images and GIFs to your dashboards. You can also use text cards to create separations between sections of charts in your dashboards, or include links to other dashboards, questions, or websites.
To add a new text card, create a new dashboard (or edit an existing one) and click on the text card button, Aa, in the top-right:

Your new, empty text card will appear. It has two modes: writing and previewing. Toggle between the modes by clicking the eye to preview the card, or the document with pencil icon to edit the card.

You can use Markdown to format the text in your text card, create inline tables or code snippets, or even embed linked images (easy on the GIFs, friends).

Click the eye icon to see what your formatted Markdown will look like when you save the card:

To learn more, see Fun with Markdown in your dashboards.
Each question on a dashboard is in its own card that you can move around or resize as you see fit. Just click the pencil icon in the top right of a dashboard to enter the dashboard’s editing interface.
Once you’re in edit mode, you’ll see a grid appear. You can move and resize the cards in the dashboard to your liking and they’ll snap to the grid.

Metabase will automatically update a question’s display to make sure your data looks great at any size you choose.
You can change a question’s visualization settings on a dashboard (to add a goal line, for example,) without affecting the original question. Click on the pencil icon to enter dashboard edit mode, hover over the question you want to edit, and click on the palette icon to edit the question’s visualization’s settings.

You can search for any dashboard (or question, collection, or pulse) by its title in the big search box at the top of Metabase.
After a while, your team might accumulate a lot of dashboards. To make it easier to find dashboards that your team looks at often, you can pin them to the top of a collection. From the collection screen, click and drag a dashboard to the top, or click on the … menu and select Pin this item.

After you’ve made your ideal dashboard, you may want to put the dashboard on a TV to help keep your team up to date throughout the day.
To enter fullscreen mode, click the fullscreen icon in the top right of the dashboard (the icon with the arrows pointing in opposite directions).
Once you’ve entered fullscreen mode, you can also switch the dashboard into “Night mode” for higher contrast.

If your data updates frequently, you can set up your dashboard to refresh automatically by clicking on the clock icon.

You can set your dashboard to update in 1, 5, 10, 15, 30, and 60 minute intervals, depending on how fresh you need the data to be.
Enabling auto refresh will re-run all the queries on the dashboard at the interval you choose, so keep the size of the dashboard and the complexity of the questions in mind when setting up auto refresh.
Combining fullscreen mode and auto refresh is a great way to keep your team in sync with your data throughout the day.
This feature is only available on Pro and Enterprise plans (both self-hosted and on Metabase Cloud).
If your results don’t change frequently, you may want to cache your results, that is: store your results in Metabase so that the next time you visit the dashboard, Metabase can retrieve the stored results rather than query the database(s) again. For example, if your data only updates once a day, there’s no point in querying the database more than once a day, as they data won’t have changed. Returning cached results can be significantly faster, as the database won’t have to redo the work to answer your query.
You can set cache duration for a dashboard by clicking on the … > Edit dashboard details > More options.
If your Metabase administrator has enabled public sharing on a saved question or dashboard, you can go to that question or dashboard and click on the sharing icon to find its public links.
Public links can be viewed by anyone, even if they don’t have access to Metabase. You can also use the public embedding code to embed your question or dashboard in a simple web page or blog post. Check out examples of simple apps with embedded dashboards in our embedding-reference-apps repository. To learn more about embedding, check out our article on How to use Metabase to deliver analytics to your customers, as well as an article on how to combine branding, Single Sign-On, full app embedding, and data sandboxing to deliver multi-tenant, self-service analytics.
You can amend the URL of a dashboard to automatically enter fullscreen, enable night mode, or auto-refresh the dashboard. Customizing the dashboard’s URL allows you to configure the dashboard - even when you do not have any input access to the device where the dashboard will be displayed, like scripted screens, for example.
To configure a dashboard using its URL, you can add the following optional keywords: fullscreen, night, or refresh. Here’s an example:
https://metabase.mydomain.com/dash/2#refresh=60&fullscreen&night
The part that says refresh=60 sets the dashboard to automatically refresh every 60 seconds, fullscreen sets it to fullscreen mode, and night sets it to night mode (night mode only works when using fullscreen). Use an ampersand, &, in between keywords, and make sure there’s a hash, #, after the dashboard’s ID number.
There is one important limitation with the fullscreen option: for security reasons, many browsers require user interaction to initiate fullscreen. In those browsers, using the fullscreen option will enable the fullscreen UI in Metabase, but it won’t expand the browser content to fill the screen. To ensure the dashboard occupies the entire screen, either activate fullscreen by clicking the button in the UI, or use the fullscreen URL option and launch the browser in fullscreen or kiosk mode.
Archiving a dashboard removes the dashboard from searches and collections. Archiving a dashboard does not archive the individual saved questions on it — it just archives the dashboard.
To archive a dashboard, click the pencil icon to enter edit mode, then click the … menu, and select Archive.
To view all archived items, click the menu icon in the top-right of any collection page. You can unarchive a dashboard by clicking the icon of the box with the upward arrow next to that dashboard.
To make a great dashboard, you first need to decide what you want the dashboard to tell about your data. What questions will give you insight into what you want to know? It helps to think of a topic or theme for your dashboard — something like “customer satisfaction,” or “second quarter sales goals”.
Some tips:
See Making dashboards faster for tips on improving dashboard performance.
Make your dashboards more flexible and powerful by adding dashboard filters.