




What is bounce rate, and how do you measure it in Metabase?
Bounce rate is the share of website sessions with no engagement — in GA4 terms, sessions that weren't engaged: under 10 seconds, no conversion event, one pageview. It's the fastest read on whether a landing page and its traffic source actually match. (Looking for the email deliverability metric? That's email bounce rate — a different number entirely.) Measure it in Metabase from session data exported from Google Analytics, Plausible, or PostHog.
bounced sessions ÷ sessions, per
landing page and per source. Know which definition you're on: GA4 counts
engagement (time, conversions, pageviews), Universal Analytics counted only
pageviews. The two aren't comparable, and neither is meaningful as a
site-wide average.
What does a bounce rate chart look like in Metabase?
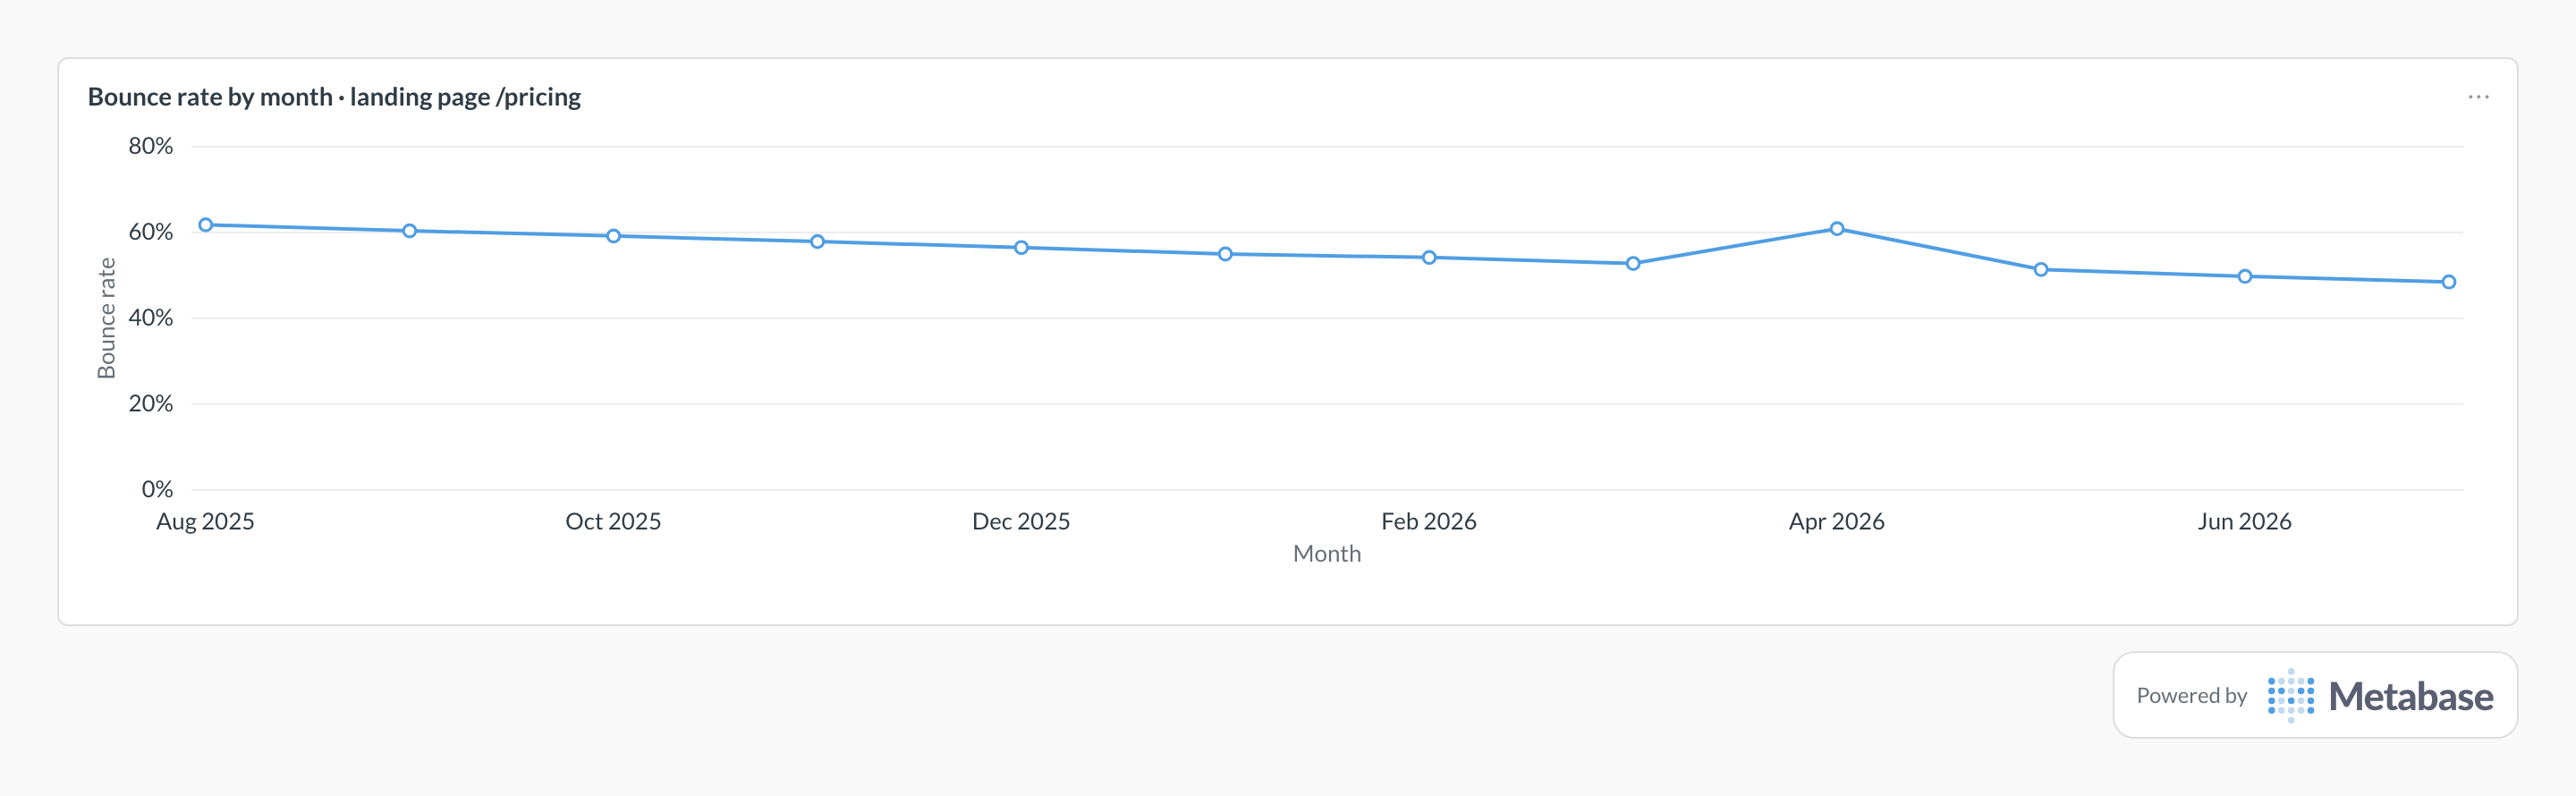
Track one landing page's bounced-session share by month and read it downward: the slide from about 62% to 48% is what page and message fixes look like compounding over a year. A one-month spike like April's usually means a new traffic burst that didn't match the page's promise — segment that month by source and medium before touching the page itself.
What bounce rate measures
It measures mismatch. A bounce means the promise that brought someone to a page — an ad, a search snippet, a social post — wasn't kept fast enough for them to do anything at all. Segmented by landing page it finds pages that underdeliver; segmented by source it finds traffic that was never going to engage. As a site-wide average it measures nothing, because it blends blog readers who found their answer with checkout visitors who fled, and feeds neither engagement rate analysis nor conversion work.
GA4 vs. the old definition
Universal Analytics called any single-pageview session a bounce, however long it lasted. GA4 inverted the frame: it defines engaged sessions — longer than 10 seconds, or containing a conversion event, or with two-plus pageviews — and a bounce is simply a session that wasn't engaged. The practical consequences: single-page content that holds attention no longer bounces, reported bounce rates fell sharply on migration without any behavior change, and any trend that crosses the migration date needs a seam drawn on the chart. If you compute bounce rate yourself from raw events, write the engagement rule into one SQL model so every card shares it.
What data does it need?
-
A
sessionstable (or a model built from raw events) withsession_start,landing_page,source,medium, and anis_engagedflag computed from duration, conversions, and pageview count. -
A
convertedflag per session if you want bounce and conversion side by side — the pairing that makes the metric actionable. - Source: the GA4 BigQuery export, or self-hosted analytics events from Plausible, PostHog, or Mixpanel landed in the warehouse by a pipeline tool.
SQL patterns
SELECT
  landing_page,
  date_trunc('month', session_start) AS month,
  COUNT(*) AS sessions,
  ROUND(
    100.0 * COUNT(*) FILTER (WHERE NOT is_engaged)
    / NULLIF(COUNT(*), 0), 1
  ) AS bounce_rate_pct
FROM sessions
WHERE session_start >= CURRENT_DATE - INTERVAL '6 months'
GROUP BY 1, 2
HAVING COUNT(*) >= 100
ORDER BY 1, 2;SELECT
source,
medium,
COUNT(*) AS sessions,
ROUND(
100.0 * COUNT(*) FILTER (WHERE NOT is_engaged)
/ NULLIF(COUNT(*), 0), 1
) AS bounce_rate_pct,
ROUND(
100.0 * COUNT(*) FILTER (WHERE converted)
/ NULLIF(COUNT(*), 0), 2
) AS conversion_rate_pct
FROM sessions
WHERE session_start >= CURRENT_DATE - INTERVAL '30 days'
GROUP BY 1, 2
HAVING COUNT(*) >= 200
ORDER BY sessions DESC;Pitfalls
HAVING clause) so small pages don't dominate
the sorted view.
Where this metric applies
- Google Analytics + Metabase — engaged-session data via the BigQuery export
- Plausible + Metabase — lightweight session stats by page and source
- PostHog + Metabase — raw events to build your own engagement rule
- Mixpanel + Metabase — session and event exports for engagement models
Related
Metrics
Dashboards
FAQ
How does GA4 define bounce rate?
Bounce rate vs. exit rate — what's the difference?
Is a high bounce rate on blog posts a problem?
Is this the same as email bounce rate?
How do you track bounce rate in Metabase?
is_engaged flag. Then chart 1 − engaged ÷ sessions by landing page and by source/medium, and pin both next to engagement rate on a website analytics dashboard.