3 min read
‧ 3 min read

On February 9, 2023, we met with Candice Ren, founder and CEO at 173Tech, an analytics agency helping companies of all stages turn data into powerful growth engines.
In this webinar Candice covered:
Let’s take a mock business called 173Peeps, which is an Human Resources platform targeting small to medium businesses. The customer journey begins with Emily, an agency owner who saw an ad on LinkedIn from 173Peeps. She clicked on the ad, landed on the website, filled in her details, and downloaded a white paper on how to automate payrolls.
The sales team picked up the lead, called Emily, arranged a demo, and the product turned out to be exactly what she needed. Emily signed up for a one-year subscription starter plan using the platform. Later on, the marketing team reached out to her by email, promoting a new feature for timesheet tracking, which she needed for her business. Emily upgraded her plan and continued to use the product happily throughout the year. When it was time for renewal, she signed up for another year.
While Emily’s journey is a quick example, customer journeys in reality can be more complicated, with many more variations. There are various data touch points and sources, including marketing channels like LinkedIn, Facebook, and others, data collected throughout the platform, and third-party services like Google Analytics.
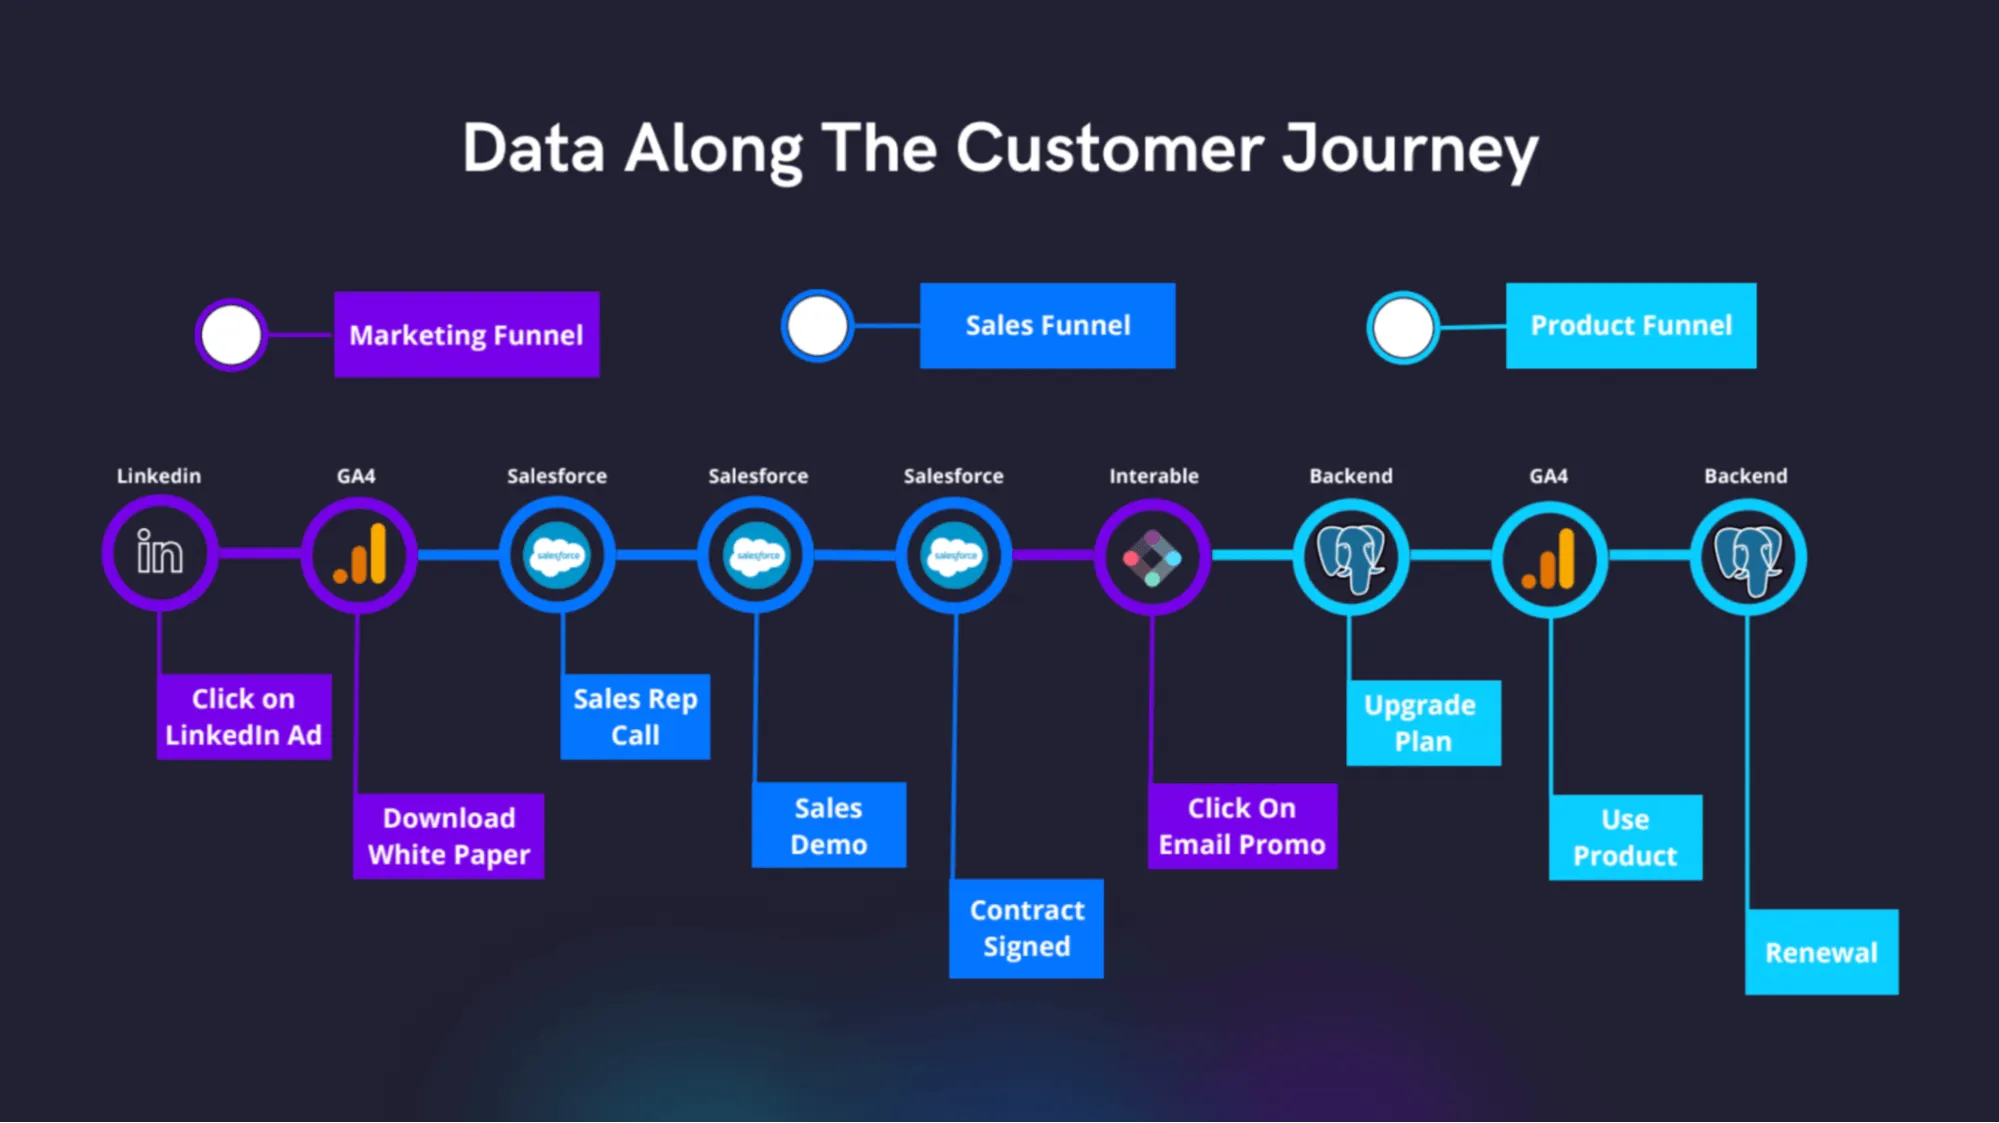
By analyzing data from the marketing funnel, such as identifying when customers drop off at the demo stage, you can automate targeted campaigns to re-engage them.
For example, Emily’s biggest pain point is the time she spends on payroll. To help your sales team communicate better with her, you can provide them with automated scripts that are more tailored to her needs, which will increase the chances of her progressing to the next stage.
To better understand your customers, you can integrate your cost components and see how different products and cohorts of customers contribute to overall profitability.
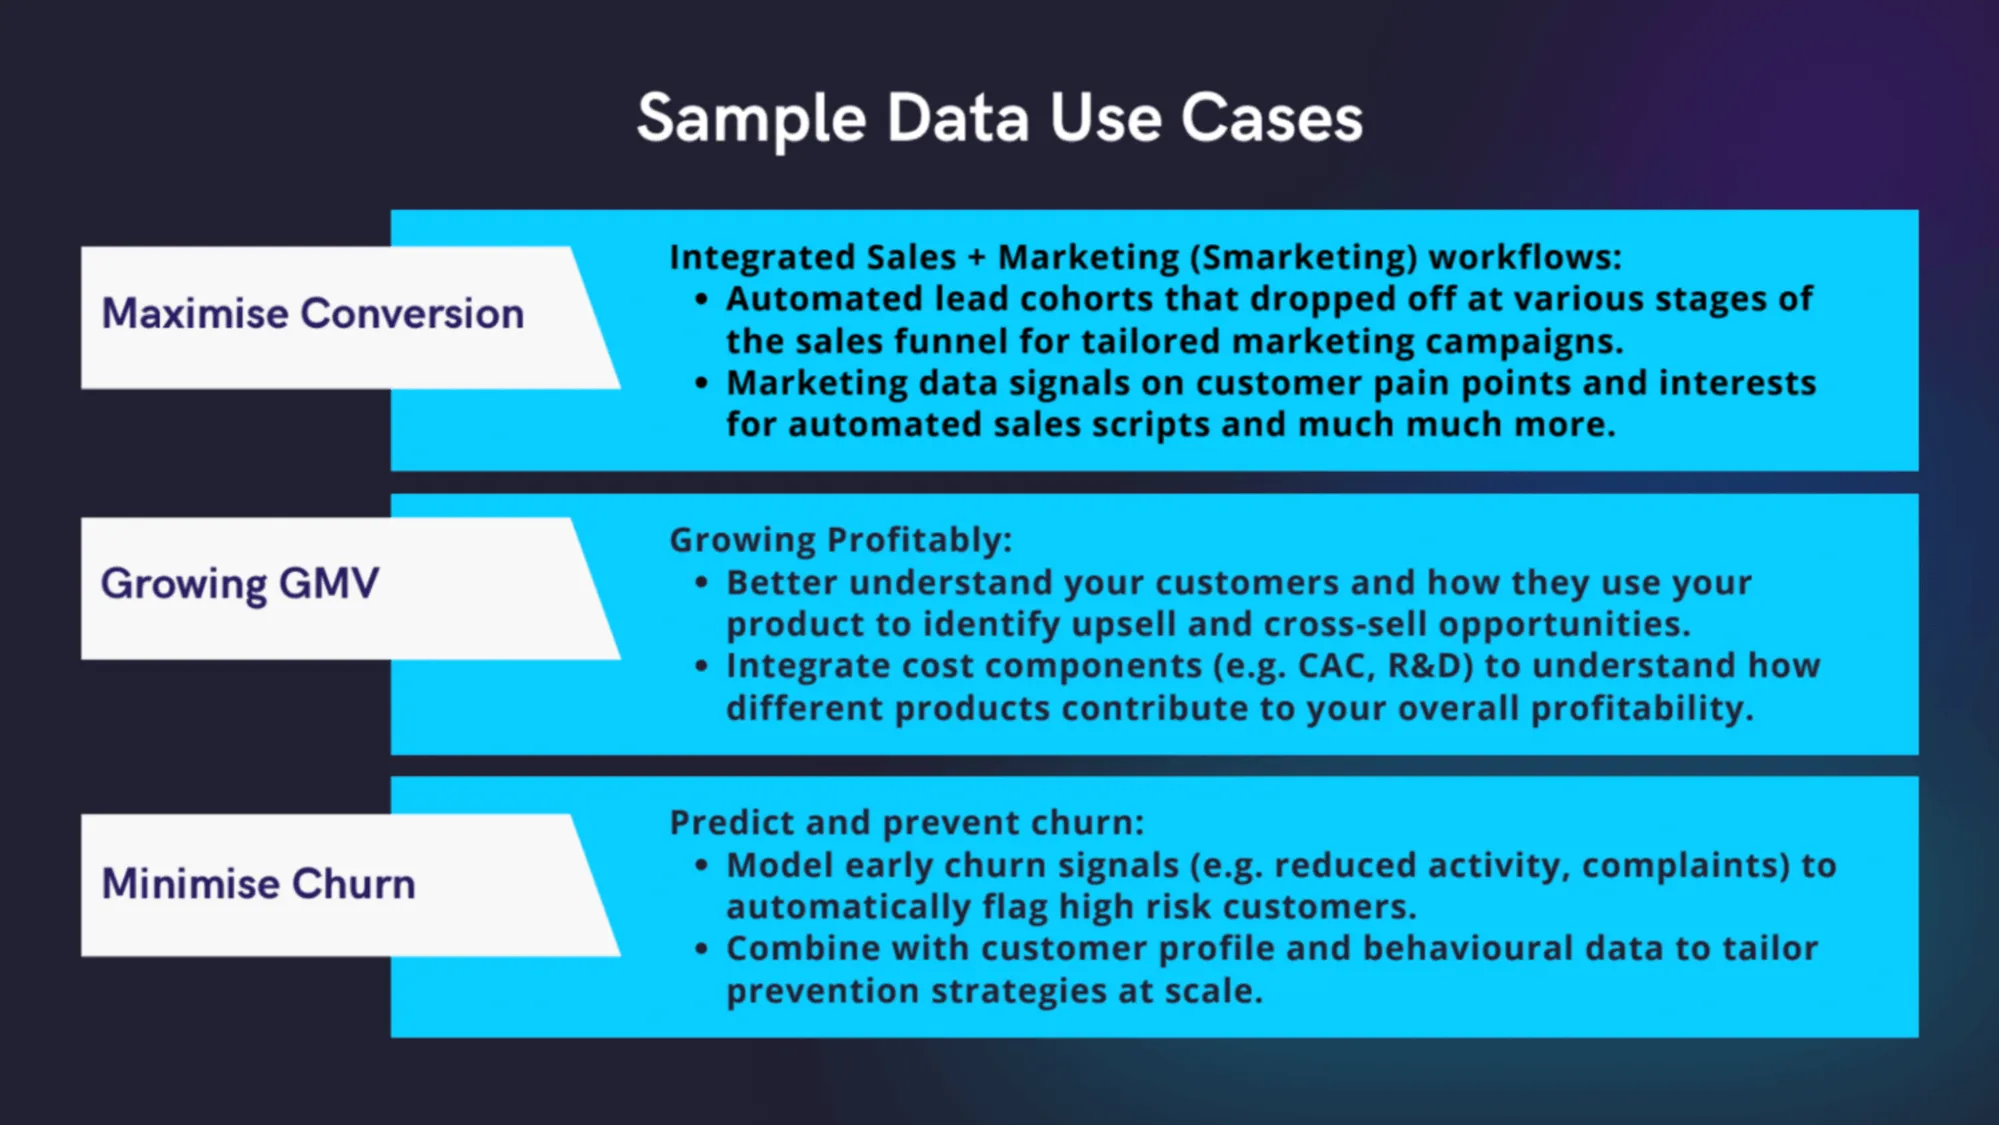
To reduce customer churn, look for trend signals such as reduced activity, fewer product uses, and complaints. That way you can flag customers who are at risk and tailor your prevention strategy in a privacy-friendly way.
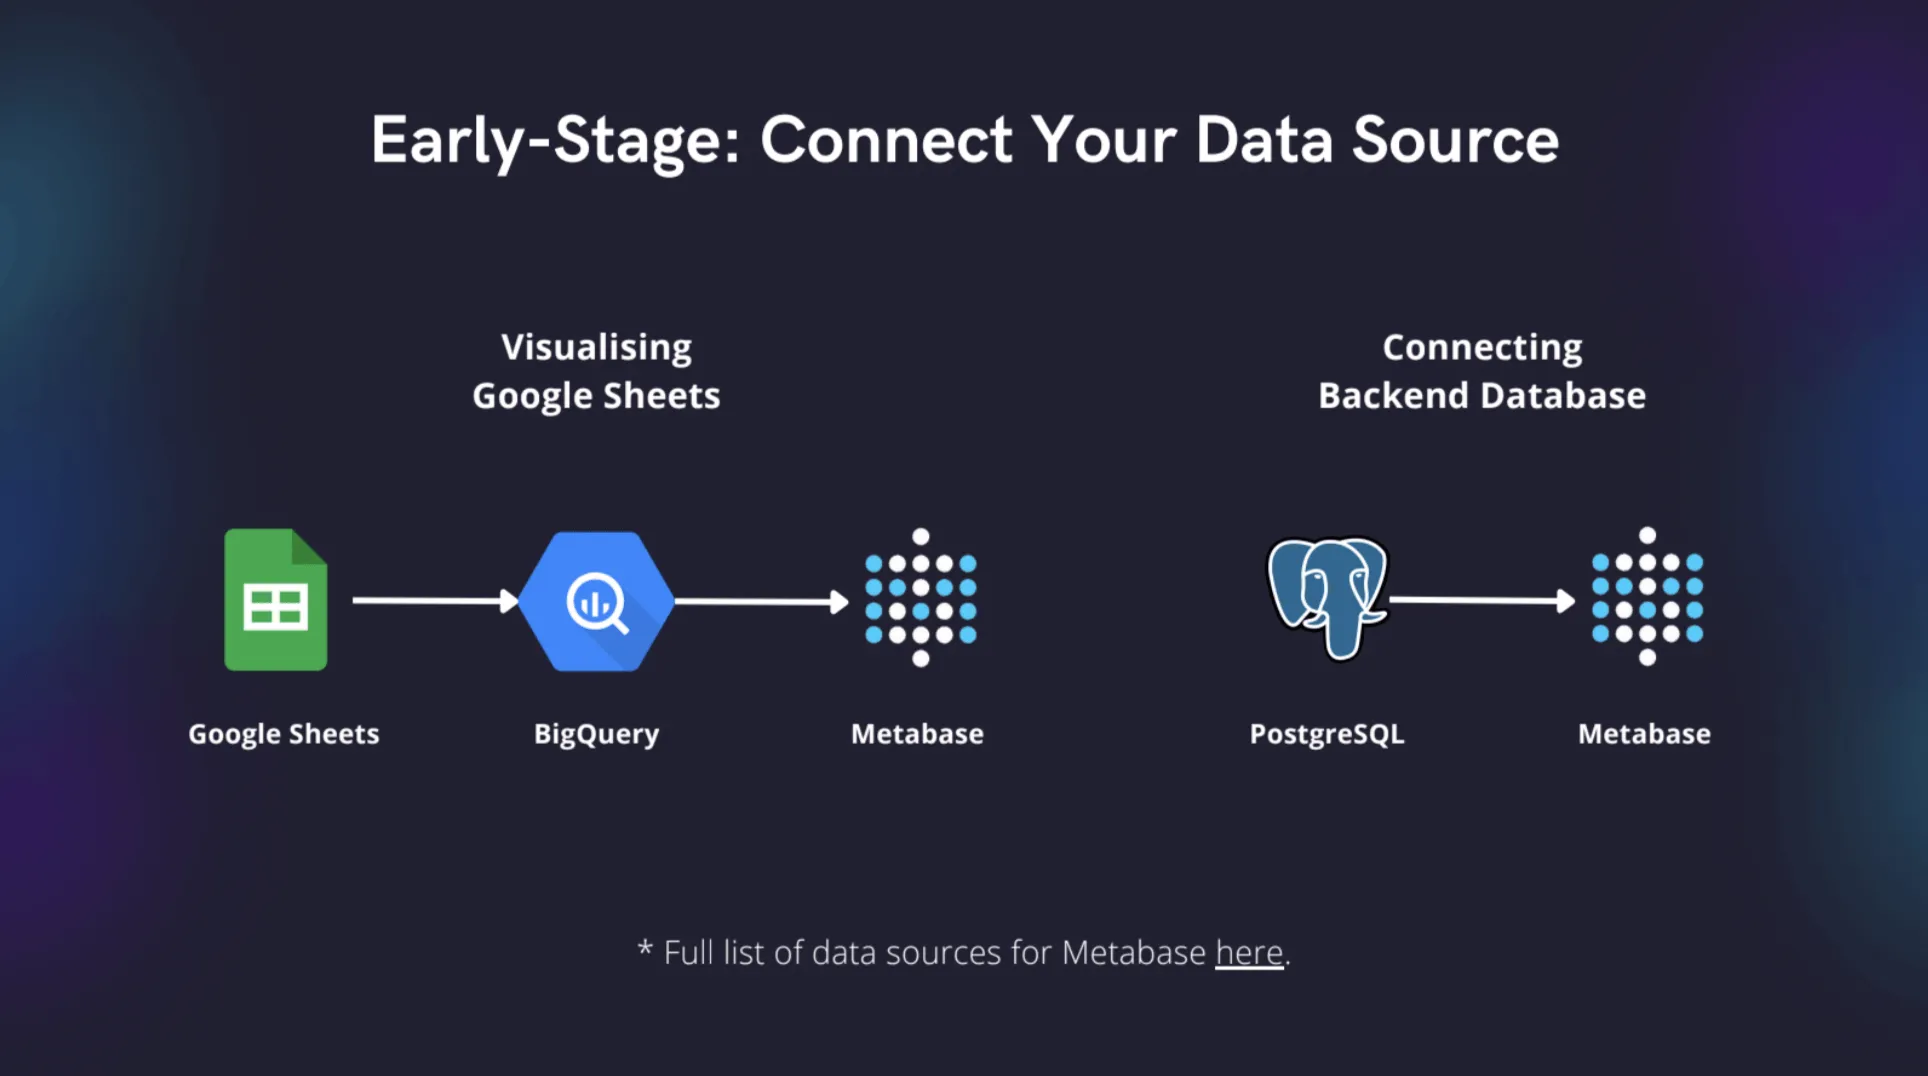
If you’re thinking that your data isn’t quite there yet, or you’ve been growing rapidly and your data isn’t ready for advanced analysis, you could consider migrating to a modern analytics stack. This stack includes a data source, such as an application database or Google Sheets, which can be funneled into a data warehouse to centralize all your different data sources, and reporting tools to analyze that data.
As you grow, you’ll accumulate many different data sources, such as HubSpot, Interval, and various marketing channels. Extracting all of this data automatically into your data warehouse is crucial. Once the data is in there, you can model it for analysis.
Once you’ve modeled your data and flagged customers as at-risk, you can run an ETL to put that information into the apps your companies use when interacting with customers.
If you’re feeling overwhelmed by the number of tasks involved in implementing a modern analytics stack, don’t worry. Focus on quick wins such as identifying low-hanging fruits and integrating your key data sources. Start with gathering all your data in one place to keep track of your main business KPIs.
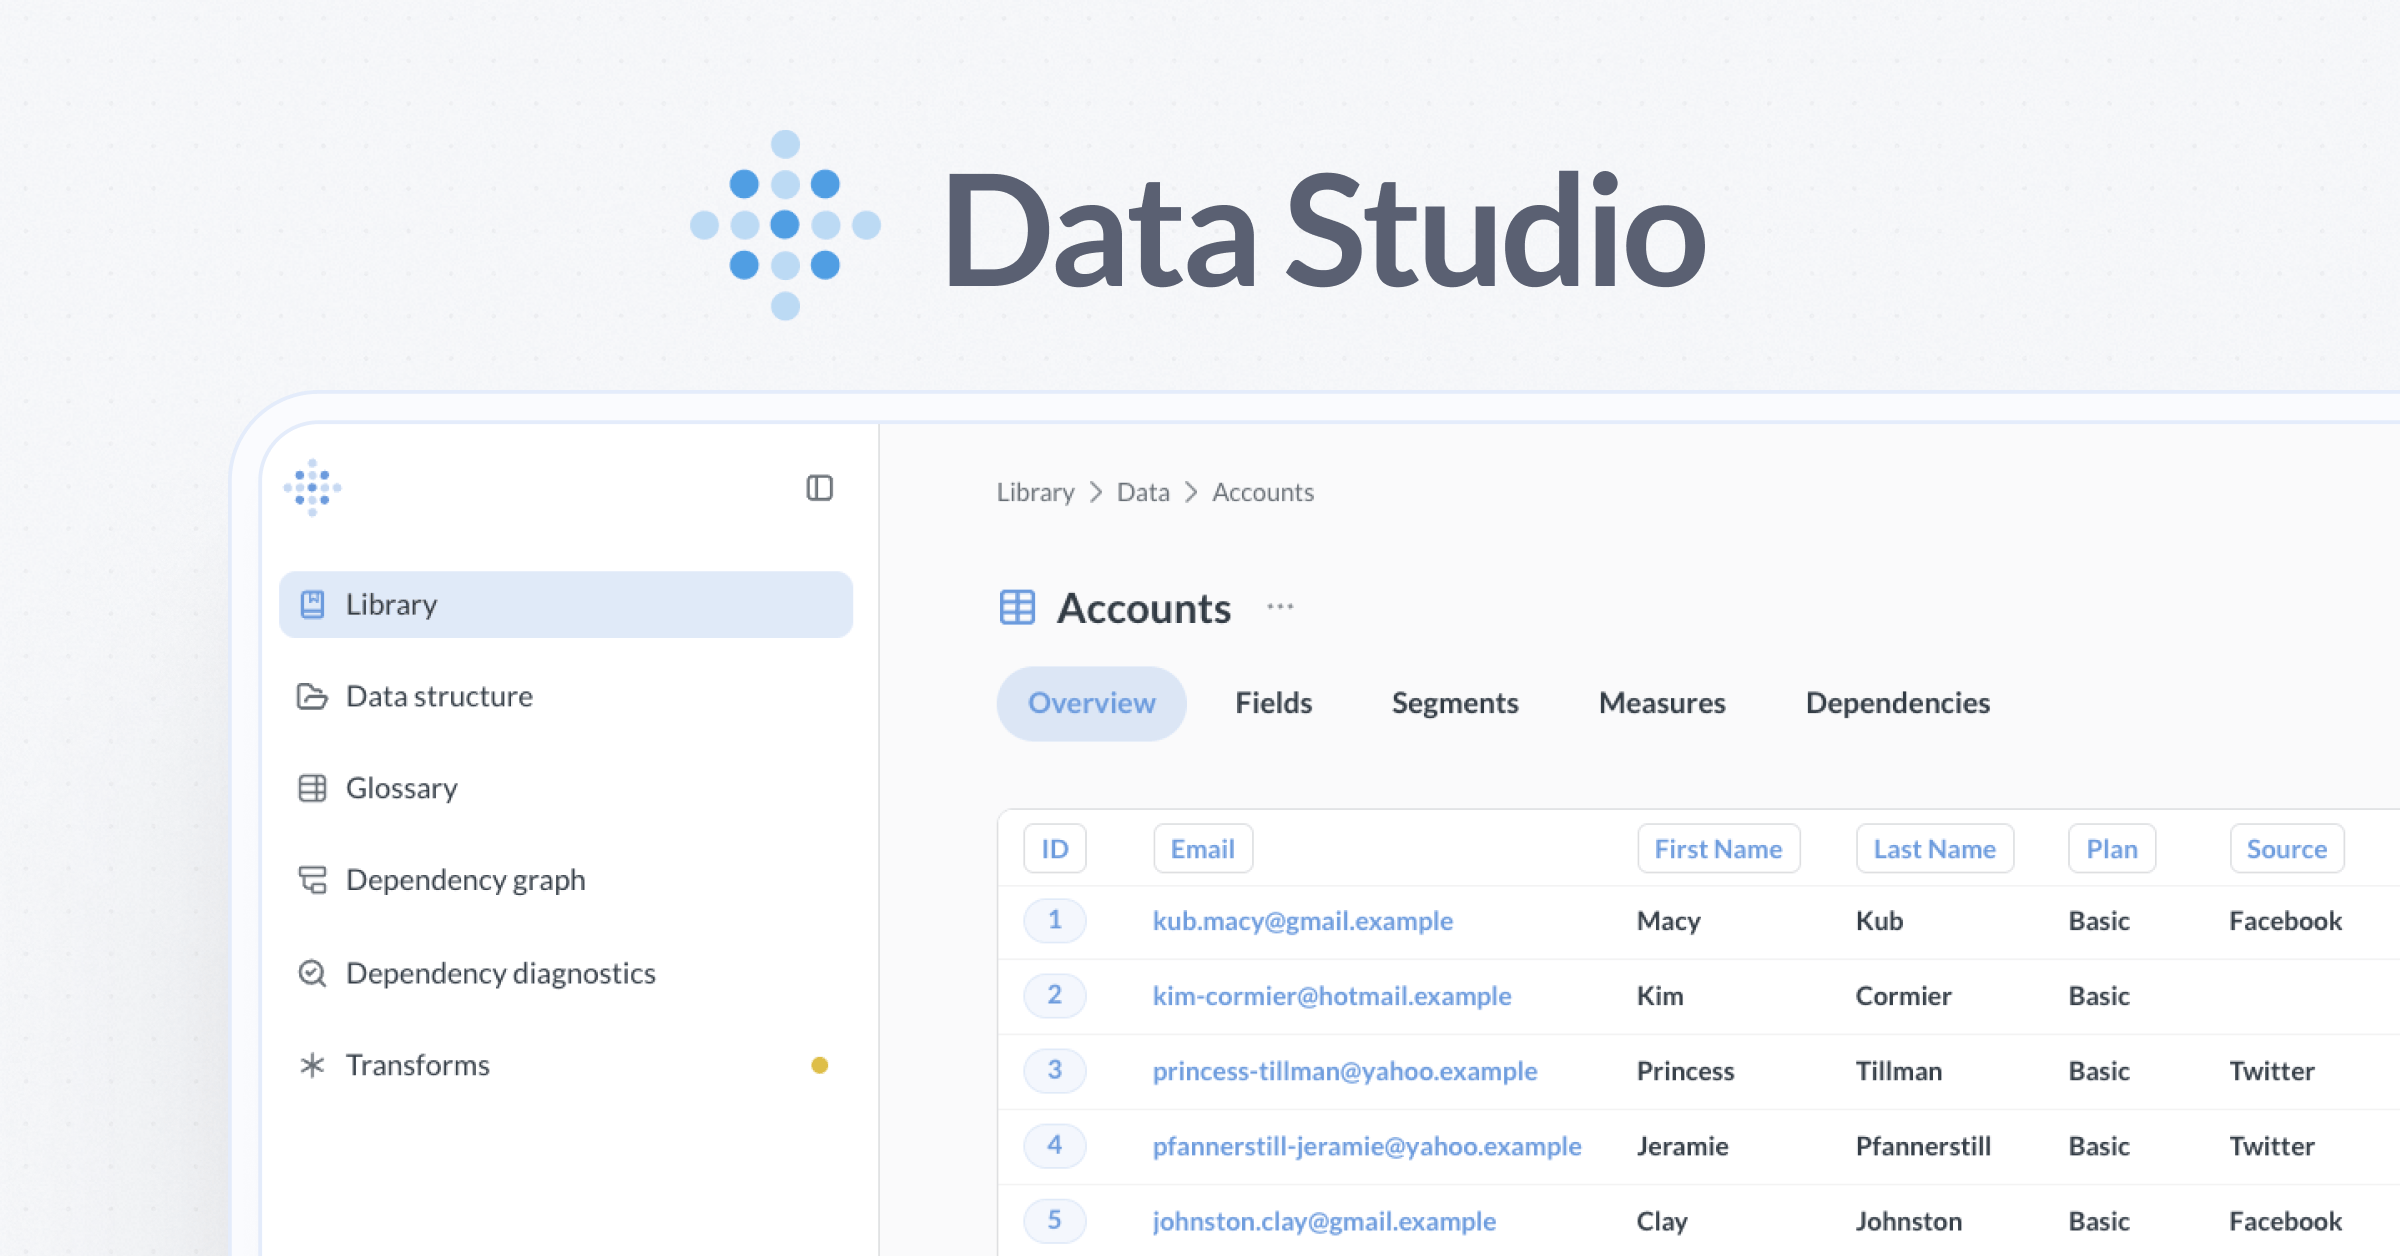
Once you have all of your data models in your warehouse, build easy-to-use dashboards that provide a high-level view of the health of your business. A master dashboard that provides an overview of the complete business can be a good place to start, followed by individual dashboards for each team (such as sales, marketing, or product features). Make it as easy as possible for all team members to use and get value from the reporting tool.