‧
8 min read
Halloween Edition: Data Horror stories in startups
The Metabase Team
‧ 8 min read
Share this article
On October 20 2022, we sat together with Amogh Sarda, co-founder of Eesel, and Ali Baghshomali, data expert from Mentat Analytics, to discuss some data horror stories at startups and what can one do to avoid them. We talked through real-life stories that could happen to a young company, explaining the motivations and potential consequences of those.
Below is a short excerpt from the conversation as well as a full recording of it.
Attendees:
- Amogh Sarda, co-founder of Eesel, a tool that brings all your work docs, right to your new tab. He’s based in Australia and was perviously a product manager for Atlassian and Intercom. He loves improv comedy and reckons startup life might be an improv show.
- Ali Baghshomali is the creator of Product Analytics Academy, an online school that provides high-quality product analytics courses. He’s also the founder of Mentat Analytics, a top-rated analytics consulting agency. He previously worked on the data teams at Bird and Buzzfeed.
- Cynthia Balusek, our host and VP of Success Engineering at Metabase.
What can go wrong with the events management in a startup
Amogh: The story I’d like to share is about how we wired events for Eesel, and in particular, dealing with events tracking when you’re in the early stage.
Eesel is a browser extension that filters out your search history and only shows your work-related links right in the new tab. It started with our desire to build a new feature for team collaborations. To track how it performs we set up events tracking like projectCreated, projectOpened… Seemed to be easy and straightforward, right?
But actually, in three months from the feature launch, we renamed “Projects” to “Folders”, which changed the event name from projectCreated to folderCreated, etc. Well, that’s also manageable; we created custom events and sort of updated these names.
But then we understood that we also needed some more nuanced events, like for example settingOpened or linkClicked. While we were tracking this, we also happened to update our product, and there appeared new places from where these folders could be opened. So we needed new events for them too.
The question that we faced at some point was: Should we miss on data, or lose a lot of time and energy to keep things up to date?
We discovered this react hook, in other words a “Universal click”, which basically listens to all clicks (buttons, links, selects) and passes the metadata associated with whatever was clicked. There is no need for us to come up with all these different names of the event, and there is no need to QA the events. This solution is platform agnostic, and can be used with almost every tool out there. This really made our lives at Eesel easier.
Ali: Amogh, you touched on something that a lot of teams struggle with, which is the work required to track all this event data.
The way we could think of Universal Tracking is sort of a tradeoff between doing everything yourself, or allowing autotracking do the work for you. The pros of doing autotracking is you capture a lot of data, you save development time on going back and edit your events settings.
The downside, on the other hand, is that data ends up being a lot messier. Since you’re tracking everything, you get a lot of event data flowing in, and there will certainly be data that might not be useful. For example, if you make changes to the structure of your product, the event name will end up changing. That will add some work on the data governance side where you’ll have to go and manually update event names for the data to be consistent.
The other downside is that you’ll be missing out on a lot of event properties information that might be specific to the items that you’re tracking.
Event data refers to specific actions or occurrences in the app. Let’s take a simple example of buying something online. You search for a product, you view an item’s details, you add it to the cart, and you purchase it. Each of those occurrences will have an event trigger which is a data point that says: “Someone searched” or “Someone added an item to cart”. Events are timestamped so you can know which one happened when relative to each other.
Events have contextual information alongside them called properties. It’s not enough to know that someone has searched for something, you also would want to know what was the thing that they searched for. For example, for the event “Item searched”, the property would be “Search term”, “Search category”, etc. Or for the event “Item purchased”, the property would be “Price of the item”, “Amount purchased”, etc. When you do autotracking you no longer have custom properties set up.
The recommendation here is to do a hybrid event management which is to put some autotracking to capture a set of things in order not to have gaps in your data, but also make sure you do manual event tracking because otherwise you’re probably gonna miss out a lot of information.
I’d also recommend that you treat the analytics portion as a part of the product development cycle. So for every feature that you build, you should have a list of questions that you want to answer about that feature, or metrics that you want to track ahead of time. That way you can come up with the set of events and properties ahead of time that will help you to answer those questions in future. That way every time something new is shipped, the event tracking information is shipped alongside it. I cover this in more detail in our product analytics courses.
Data management for startups: when to chose the right tool
Amogh: The other story I wanted to share is about our first data stack. We had a few thousand users without any database at the beginning, and we used a combination of the Intercom and Google sheets. All event analytics were coming in from Intercom, and in particular we used out-of-the-box user attributes that Intercom gives. For any particular user, we were getting things like Signed up, Last seen, Browser, OS, and also some custom attributes like “Appversion”, “Amount of space Eesel uses”, etc.
At that time Intercom didn’t have too many data visualization reports available. There also wasn’t a way to visualize a trend overtime. So I was manually exporting the data to the Google Sheets and creating visualizations out of that. We leveled up with time and started to use Metabase, Mixpanel, and Segment.
Ali: Starting with Google Sheets is very common for startups, and it’s actually a very powerful tool. Part of the struggle is that you need to keep exporting, cleaning, and updating the data manually. There’s always this question for an early stage startup: “Which tool should we be using, and when is the time for each?” This is one of the most common questions I get when working with my clients. Even though all companies are different, and there is no one analytics framework that works for all of them, still there is a rough rule that can help you to choose the right tool at the right stage.
-
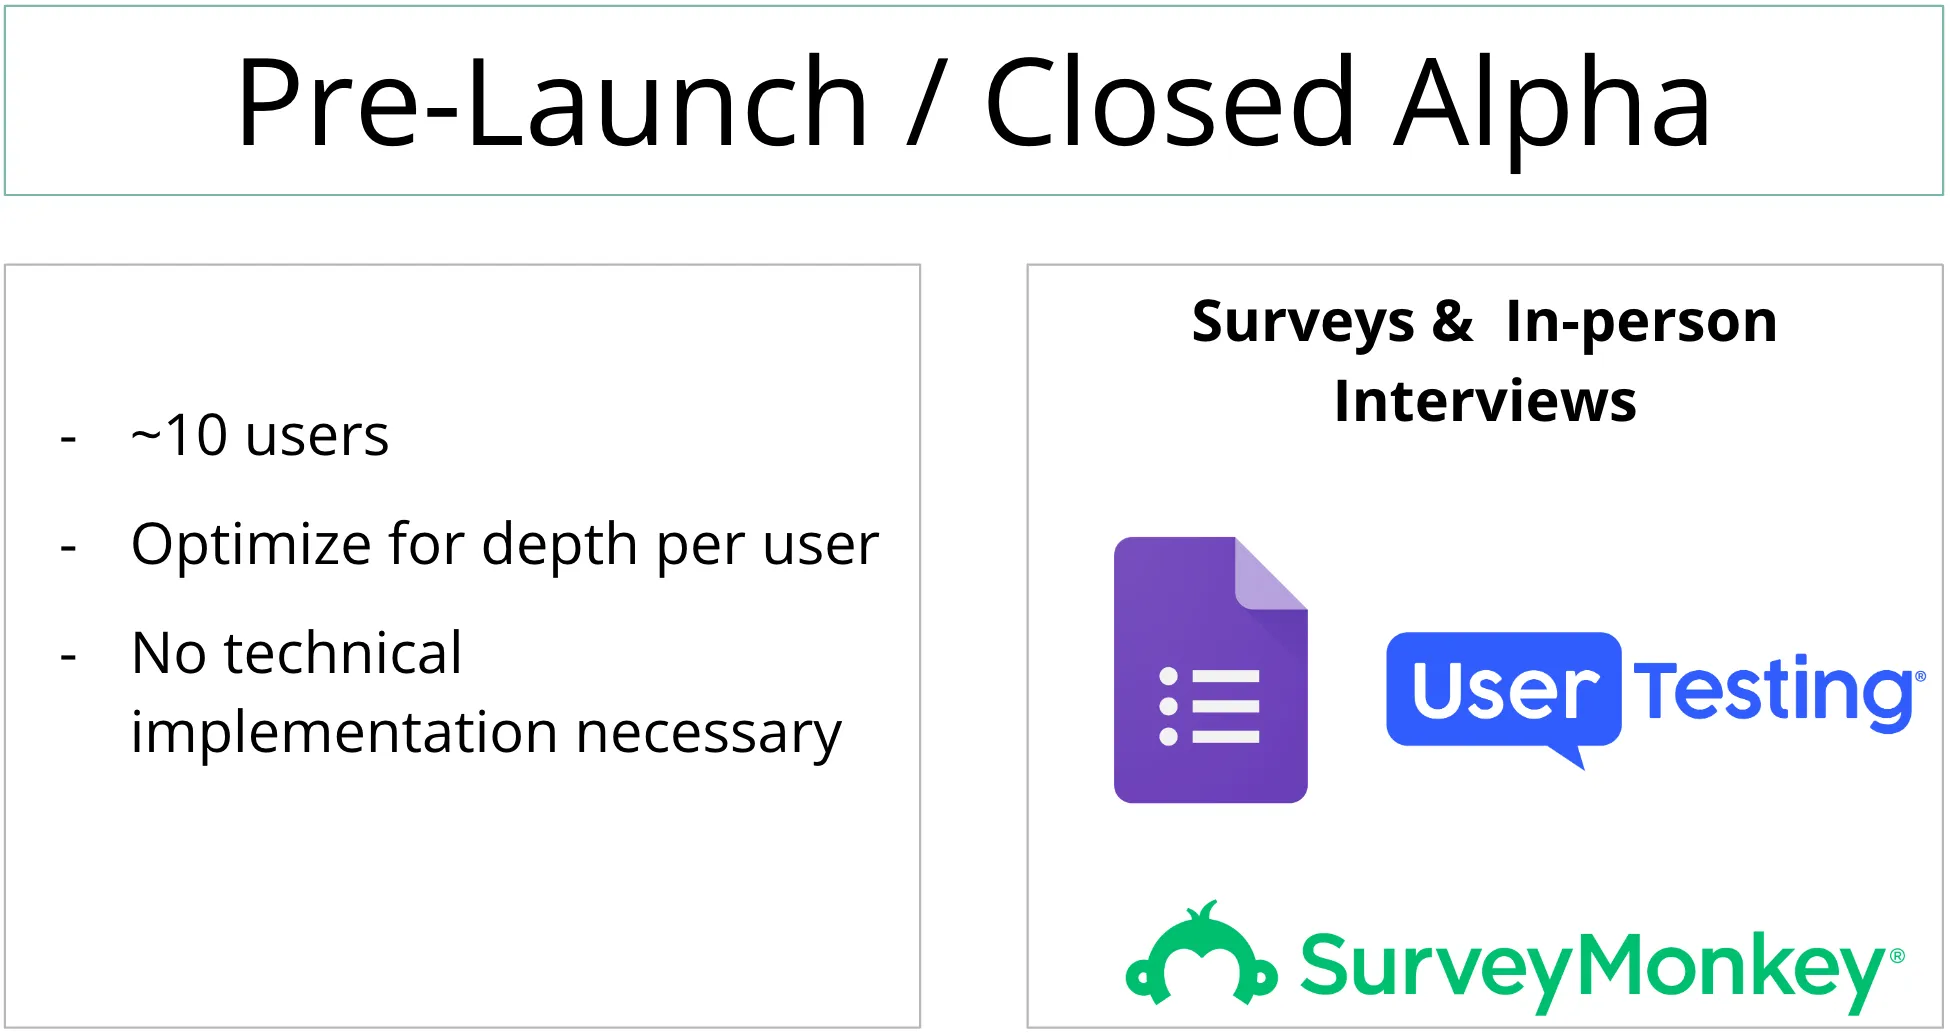
Pre-launch/ Closed Alpha: When you are in the very early stage (~10 users) you want to focus on qualitative side of things and get deeper into conversations with your users.
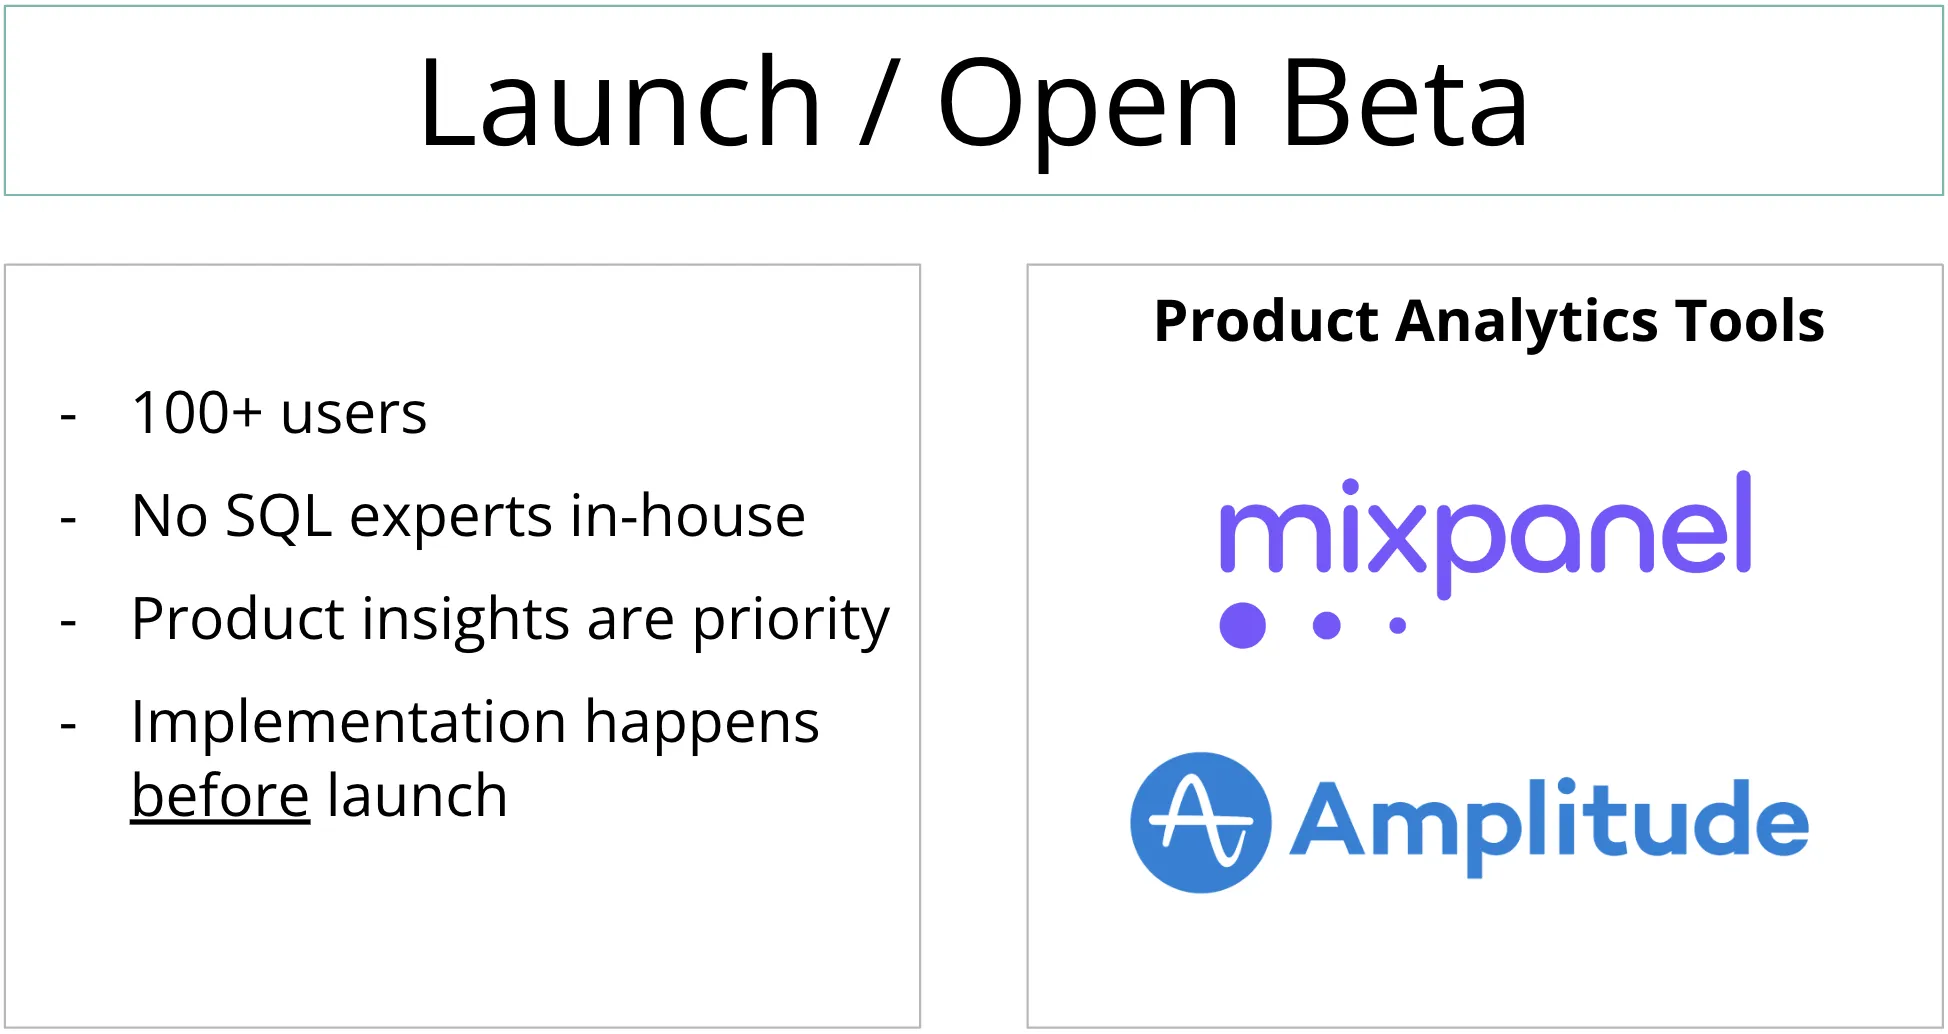
-
Launch/Open beta: When you launch, and have about 100 users, and don’t have SQL expertise in the team yet - product insights become your priority. It’s always recommended to set this up before you launch to have everything in place afterwards.
-
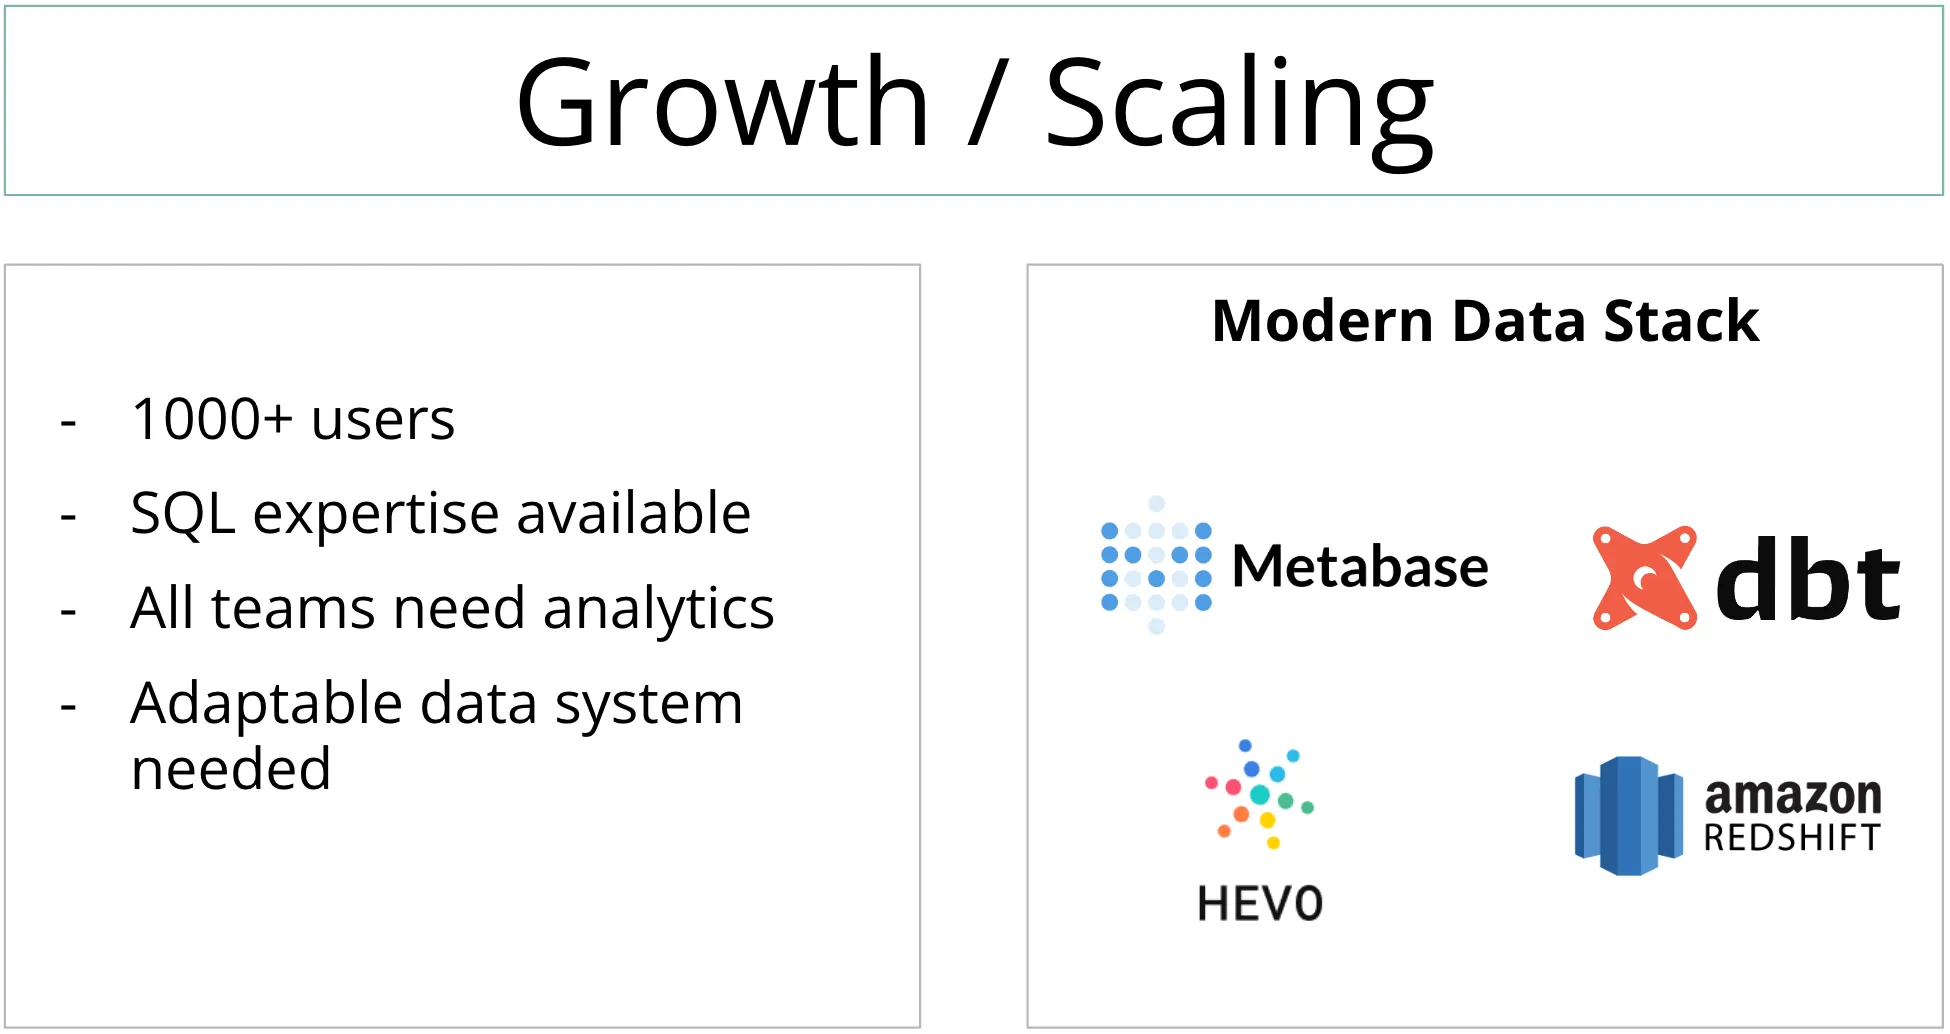
Growth/Scaling: While the previous setup works great for product insights, it does not actually cover business analytics, which is what a tool like Metabase is for. At 1000+ users you can start implementing a modern data stack. The one thing I suggest you to have before starting setting up MDS is having someone on the team who is experienced in SQL. Even though tools like Metabase don’t necessarily require you to know SQL, still SQL is the main way to get the most out of your data. So if you want to move forward with establishing a modern data stack, wait until a data person appears on your team and can get ownership of this.